Medicare Advantage 2026: A Year of Strategic Consolidation and Selective Growth
Comprehensive Market Analysis & Industry Outlook
- December 1, 2025
- 7 min read
- Based on CMS landscape and Plan crosswalk data
Executive Summary
The Medicare Advantage market in 2026 represents a pivotal inflection point—shifting from aggressive expansion to strategic consolidation. While plan counts declined for the second consecutive year, but Individual MA enrolment rose from 28.23 million to 29.43 million as of November 2025, with penetration up from 41.9% to 42.8% The market now exhibits clear divergence: specialized segments (D-SNP, C-SNP) are flourishing while traditional offerings contract as payors optimize portfolios for sustainability and performance.
Total MA Plans
-113 plans (-2.0% YoY)
MA Enrollment
+1.20M (4.3% YoY)
Market Penetration
New Plans Added
+102 plans (+12.5% YoY)
Active Payors
+4 payors
Key Market Insights
- Market Maturation: Second consecutive year of plan count decline (-2.0% YoY), signaling shift from expansion to optimization phase
- Specialized Growth Engine: D-SNP (+14.8% YoY) and C-SNP (+42% YoY) emerge as twin growth drivers, addressing complex care needs
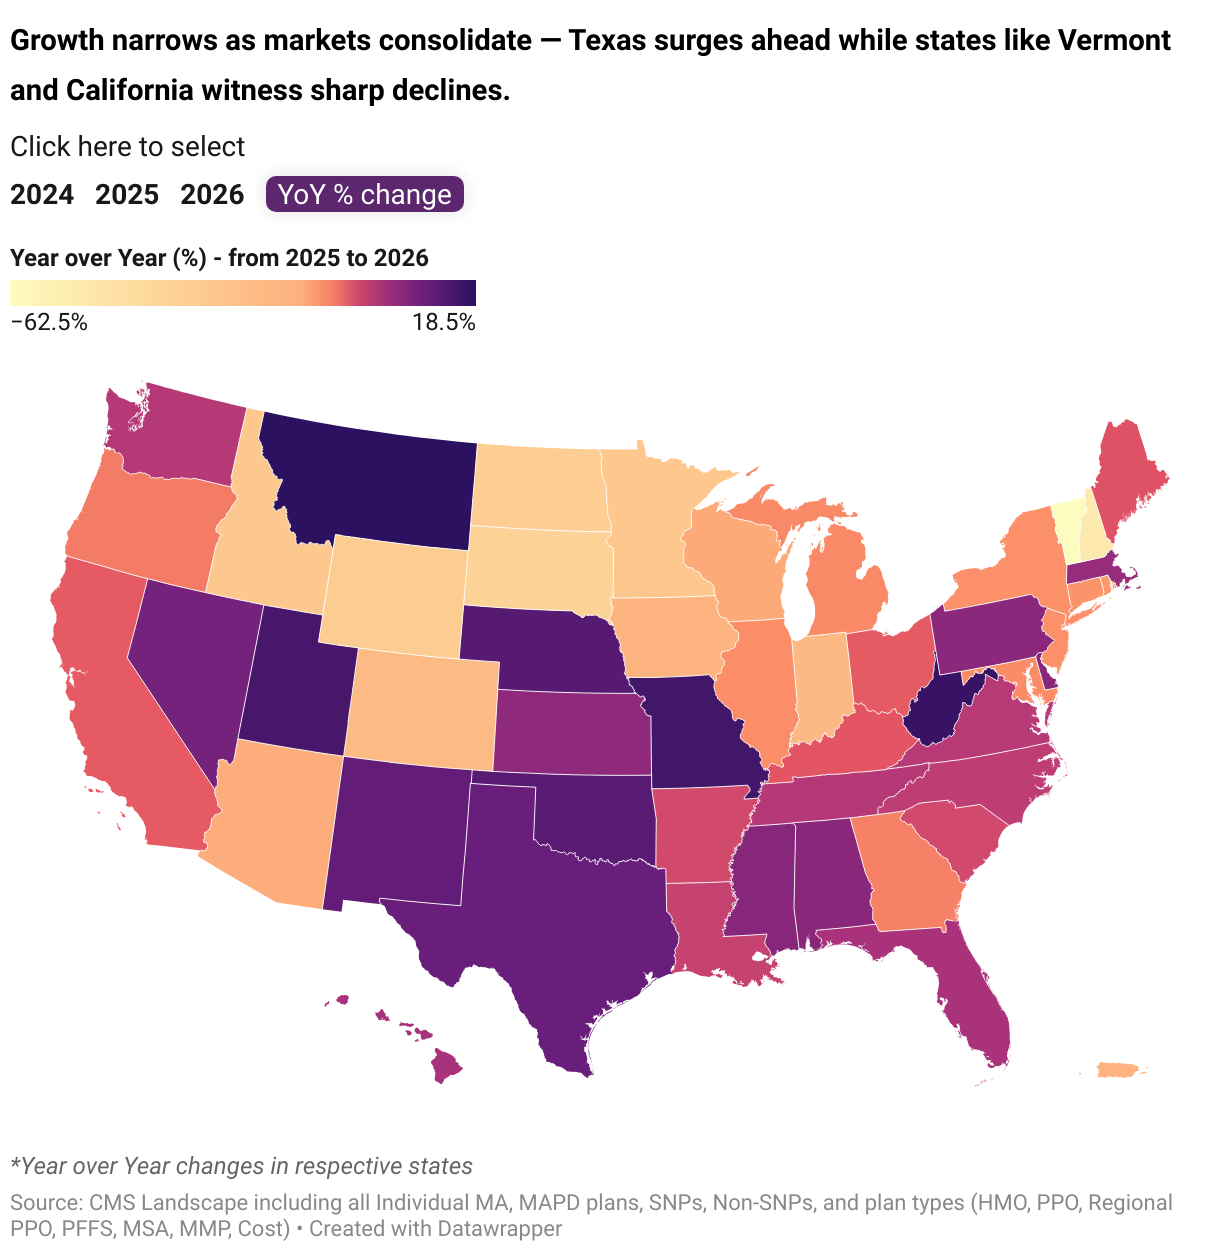
- Regional Concentration: Only 39% of states recorded growth; Texas (+10% YoY), Missouri (+15% YoY), and Pennsylvania (+5% YoY) lead expansion
- Leadership Shift: Humana overtakes UnitedHealth as #1 payor with 887 plans; Devoted Health disrupts market with 195% growth since 2024
- Plan Type Divergence: HMO plans strengthen to 65% market share while PPOs retreat (-7% Local, -12% Regional)
- MAPD Dominance: Integrated medical-drug plans maintain resilience with 5,158 offerings (92% of total market)
- Strategic Realignment: Service Area Reduction (SAR) renewals surge to 745 from 214 since 2024, indicating portfolio optimization focus
1. National Plan Landscape: From Growth to Strategic Refinement
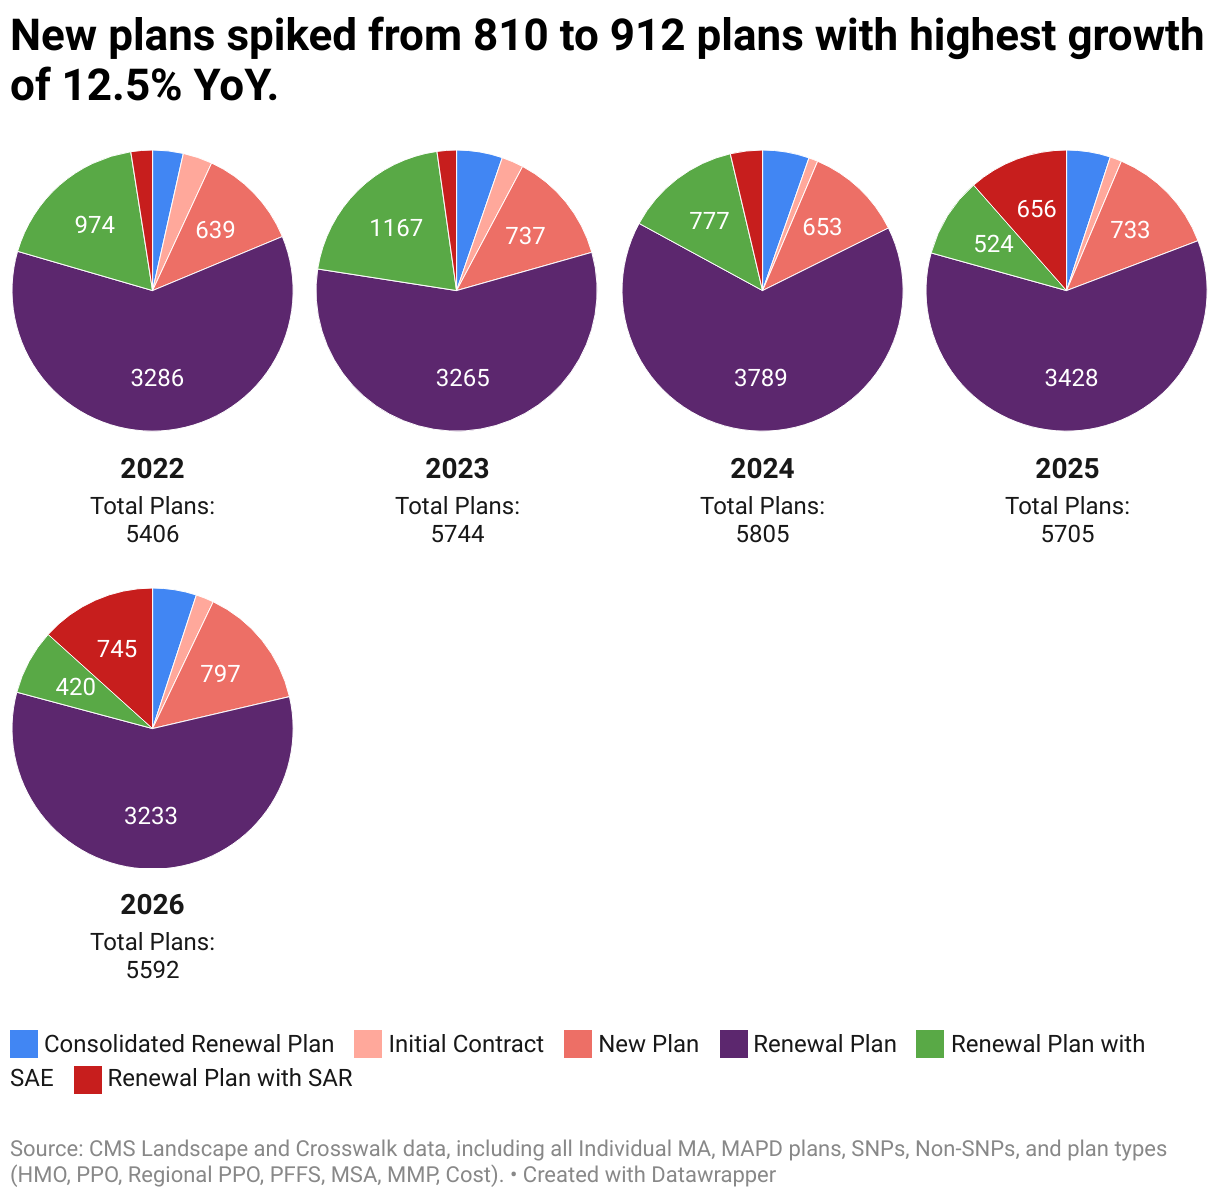
After peaking at 5,805 plans in 2024 following two years of healthy growth (+6.3% in 2023, +1.1% in 2024), the Medicare Advantage market has entered a consolidation phase. Total plan counts declined to 5,592 in 2026, marking the second consecutive year of contraction with a 2.0% year-over-year decrease.
Growth Trajectory
| Year | Total Plans | YoY Change |
|---|---|---|
| 2022 | 5,406 | — |
| 2023 | 5744 | +6.3% |
| 2024 | 5,805 | +1.1% |
| 2025 | 5,705 | -1.7% |
| 2026 | 5,592 | -2.0% |
Plan Category Shifts (2026)
| Category | Count | % Total |
|---|---|---|
| Renewal Plan | 3,233 | 57.8% |
| New Plan | 797 | 14.3% |
| Renewal Plan with SAR | 745 | 13.3% |
| Renewal Plan with SAE | 420 | 7.5% |
| Consolidated Renewal Plan | 282 | 5.0% |
| Initial Contract | 115 | 2.1% |
New Plan Activity: A Bright Spot
Despite overall market contraction, new plan launches surged to 912 total new offerings (including Initial Contracts), representing the highest addition in recent years with 12.5% YoY growth. This rebound—from a loss of 167 plans in 2024 to an addition of 102 in 2026—signals continued market confidence and strategic entry by both established players and newcomers.
The Rise of Service Area Reduction (SAR) Renewals
One of the most striking trends is the dramatic surge in Renewal Plans with Service Area Reduction (SAR), which tripled from 214 plans in 2024 to 745 plans in 2026. This category now represents 13.3% of all plans, up from just 3.7% two years ago. The sharp increase reflects payors’ strategic focus on:
- Optimizing geographic footprints for profitability
- Exiting underperforming counties or markets
- Concentrating resources in high-value service areas
- Responding to regulatory and reimbursement pressures
Conversely, Renewal Plans with Service Area Expansion (SAE) plummeted from 777 in 2024 to 420 in 2026—nearly half their previous level—indicating a more cautious approach to geographic expansion.
What This Means for Payors
The 2026 landscape signals a fundamental shift in market strategy. Payors are no longer prioritizing geographic breadth or plan proliferation. Instead, they’re focusing on:
- Portfolio optimization: Consolidating underperforming plans and enhancing star performers
- Profitability over volume: Exiting low-margin markets in favor of sustainable growth
- Strategic market selection: Concentrating on regions with favorable demographics and regulatory environments
- Specialized product focus: Shifting investment toward SNP and integrated care models
This consolidation phase, while resulting in fewer overall plans, positions the market for more sustainable long-term growth built on value-based care delivery and operational efficiency.
Note
The total number of plans is divided into several categories, which include Renewal Plans, Consolidated Renewal Plans, Renewal Plans with Service Area Expansion (SAE), Renewal Plans with Service Area Reduction (SAR), Initial Contracts, and New Plans.
New Plans indicate both New Plans and Initial Contracts. Renewal Plans is combination of Renewal Plans, Consolidated Renewal Plans, Renewal Plans with SAR and Renewal Plans with SAE.
Top Growth States: The Southern Surge
| State | Number of Plans in 2025 | Number of Plans in 2026 | Absolute Change | YoY |
|---|---|---|---|---|
| Texas | 385 | 423 | 38 | 10% |
| Missouri | 136 | 157 | 21 | 15% |
| Pennsylvania | 316 | 332 | 16 | 5% |
| Florida | 592 | 605 | 13 | 2% |
| West Virginia | 59 | 69 | 10 | 17% |
| Oklahoma | 73 | 82 | 9 | 12% |
| Nevada | 97 | 105 | 8 | 8% |
| Utah | 48 | 55 | 7 | 15% |
| New Mexico | 66 | 73 | 7 | 11% |
| Nebraska | 48 | 54 | 6 | 13% |
| Montana | 27 | 32 | 5 | 19% |
Steepest Declines: Western and Upper Midwest Contraction
| State | Number of Plans in 2025 | Number of Plans in 2026 | Absolute Change | YoY |
|---|---|---|---|---|
| Minnesota | 115 | 84 | -31 | -27% |
| Indiana | 155 | 127 | -28 | -18% |
| Colorado | 132 | 107 | -25 | -19% |
| California | 421 | 402 | -19 | -5% |
| New Hampshire | 38 | 19 | -19 | -50% |
| New York | 236 | 218 | -18 | -8% |
| Idaho | 66 | 48 | -18 | -27% |
| Arizona | 149 | 133 | -16 | -11% |
| Michigan | 207 | 192 | -15 | -7% |
| South Dakota | 41 | 27 | -14 | -34% |
Largest Markets: Shifting Rankings
Top 10 States (2026)
Florida
(remains #1)
Texas
(jumped from #3)
California
(fell from #2)
Pennsylvania
Ohio
New York
Illinois
Michigan
Georgia
North Carolina
Market Insights
Florida’s Resilience: Despite cooling from its 2023 peak (616 plans), Florida rebounded to 605 plans in 2026, with new plans nearly doubling from 64 to 108—the highest new plan activity in the nation.
Texas Ascendant: Texas overtook California for the #2 position, adding 38 plans to reach 423 (+10% YoY), driven by favorable demographics and regulatory climate.
California’s Cooling: Once holding 492 plans in 2023, California declined to 402 in 2026, reflecting market saturation and payor consolidation in the state.
New York’s Decline: Continuing its retreat since 2023 (276 plans), New York fell to 218 in 2026, indicating sustained strategic withdrawal from this challenging market.
New Plan Distribution by State
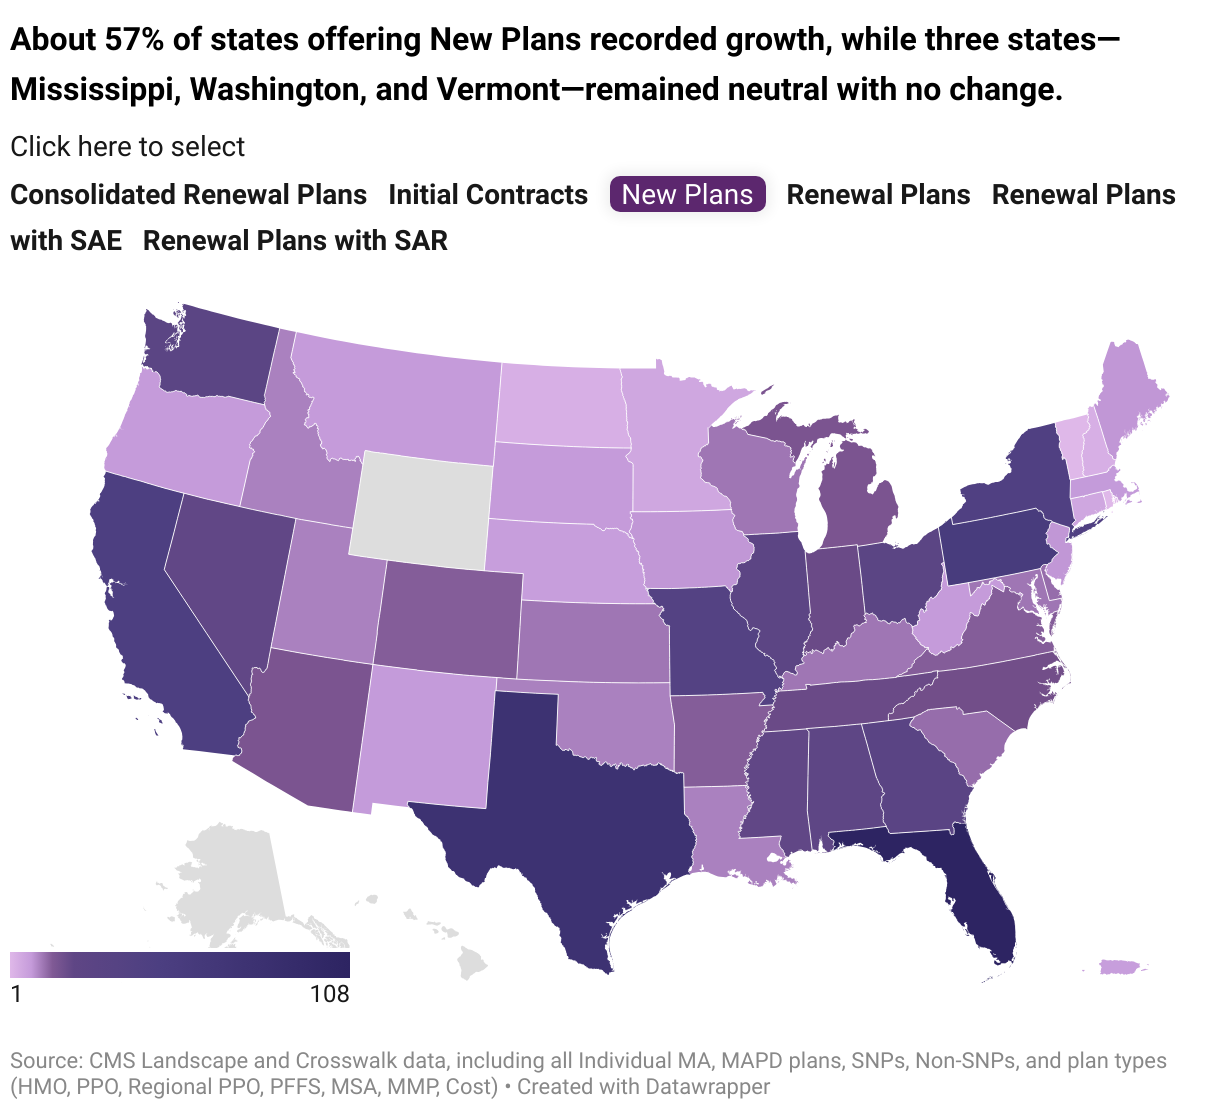
Among states offering new plans in 2026, approximately 57% recorded growth in new plan additions, while three states—Mississippi, Washington, and Vermont—remained neutral with no change in new plan counts.
| State1 | 2025 | 2026 | Change | Notable Trends |
|---|---|---|---|---|
| Florida | 64 | 108 | 44 | Leads new plan activity |
| Texas | 55 | 77 | 22 | Led in SAE (31 plans) and SAR (56) renewals |
| California | 52 | 58 | 6 | Led Initial Contracts with Louisiana (11 plans) |
| Pennsylvania | 54 | 55 | 1 | Overtook California and leads in Consolidated renewal plans |
| New York | 26 | 43 | 17 | Only New and SAR plans have upward moment. |
SAR activity is high in below states
| State | 2025 Plans | 2026 Plans | Change | |
|---|---|---|---|---|
| Michigan | 23 | 48 | 25 | |
| Pennsylvania | 21 | 46 | 25 | |
| Ohio | 23 | 44 | 21 | |
| Iowa | 13 | 28 | 15 | |
| Georgia | 35 | 48 | 13 | |
| Indiana | 41 | 16 | -25 | |
| North Carolina | 38 | 14 | -24 | |
| Kentucky | 36 | 20 | -16 | |
| Alabama | 28 | 13 | -15 | |
| Tennessee | 20 | 8 | -12 |
Vermont and Puerto Rico have no SAR renewal plans
Why the South Is Accelerating While the West Stabilizes
Southern Growth Drivers:
- Demographic advantage: Rapid Medicare-eligible population growth in states like Texas, Florida, and Georgia
- Regulatory environment: Generally more favorable state regulatory frameworks and reimbursement structures
- Lower saturation: Room for expansion compared to mature markets
- Provider collaboration: Strong payor-provider partnerships enabling network growth
Western/Upper Midwest Headwinds:
- Market maturity: Highly penetrated markets like California leave little room for growth
- Margin pressure: Higher cost structures and regulatory complexity in states like Vermont, Minnesota
- Competition intensity: Established players defending market share aggressively
- Star Ratings challenges: Payors exiting underperforming markets to protect overall ratings
Market Concentration Risk
The concentration of growth in select southern states while two-thirds of states experience decline raises concerns about beneficiary access disparities. Notably, apart from California, none of the top-performing states recorded Initial Contracts, and Wyoming and Hawaii continued to have no New Plans, highlighting the uneven regional distribution of Medicare Advantage growth
One of the most striking trends is the dramatic surge in Renewal Plans with Service Area Reduction (SAR), which tripled from 214 plans in 2024 to 745 plans in 2026. This category now represents 13.3% of all plans, up from just 3.7% two years ago. The sharp increase reflects payors’ strategic focus on:
- Optimizing geographic footprints for profitability
- Exiting underperforming counties or markets
- Concentrating resources in high-value service areas
- Responding to regulatory and reimbursement pressures
Conversely, Renewal Plans with Service Area Expansion (SAE) plummeted from 777 in 2024 to 420 in 2026—nearly half their previous level—indicating a more cautious approach to geographic expansion.
2. State-Level Market Dynamics: Regional Divergence Intensifies
The 2026 state-level landscape reveals stark geographic polarization. Only 39% of states recorded plan count growth, while 59% experienced declines and North Carolina remained unchanged at 175 plans. This regional divergence underscores how market dynamics, regulatory environments, and demographic factors create vastly different opportunities across the country.
Top Growth States: The Southern Surge
| State | Number of Plans in 2025 | Number of Plans in 2026 | Absolute Change | YoY |
|---|---|---|---|---|
| Texas | 385 | 423 | 38 | 10% |
| Missouri | 136 | 157 | 21 | 15% |
| Pennsylvania | 316 | 332 | 16 | 5% |
| Florida | 592 | 605 | 13 | 2% |
| West Virginia | 59 | 69 | 10 | 17% |
| Oklahoma | 73 | 82 | 9 | 12% |
| Nevada | 97 | 105 | 8 | 8% |
| Utah | 48 | 55 | 7 | 15% |
| New Mexico | 66 | 73 | 7 | 11% |
| Nebraska | 48 | 54 | 6 | 13% |
| Montana | 27 | 32 | 5 | 19% |
Steepest Declines: Western and Upper Midwest Contraction
| State | Number of Plans in 2025 | Number of Plans in 2026 | Absolute Change | YoY |
|---|---|---|---|---|
| Minnesota | 115 | 84 | -31 | -27% |
| Indiana | 155 | 127 | -28 | -18% |
| Colorado | 132 | 107 | -25 | -19% |
| California | 421 | 402 | -19 | -5% |
| New Hampshire | 38 | 19 | -19 | -50% |
| New York | 236 | 218 | -18 | -8% |
| Idaho | 66 | 48 | -18 | -27% |
| Arizona | 149 | 133 | -16 | -11% |
| Michigan | 207 | 192 | -15 | -7% |
| South Dakota | 41 | 27 | -14 | -34% |
Largest Markets: Shifting Rankings
Top 10 States (2026)
Florida
(remains #1)
Texas
(jumped from #3)
California
(fell from #2)
Pennsylvania
New York
Ohio
Michigan
North Carolina
same as last year
Georgia
Illinois
Market Insights
Florida’s Resilience: Despite cooling from its 2023 peak (616 plans), Florida rebounded to 605 plans in 2026, with new plans nearly doubling from 64 to 108—the highest new plan activity in the nation.
Texas Ascendant: Texas overtook California for the #2 position, adding 38 plans to reach 423 (+10% YoY), driven by favorable demographics and regulatory climate.
California’s Cooling: Once holding 492 plans in 2023, California declined to 402 in 2026, reflecting market saturation and payor consolidation in the state.
New York’s Decline: Continuing its retreat since 2023 (276 plans), New York fell to 218 in 2026, indicating sustained strategic withdrawal from this challenging market.
New Plan Distribution by State
Among states offering new plans in 2026, approximately 57% recorded growth in new plan additions, while three states—Mississippi, Washington, and Vermont—remained neutral with no change in new plan counts.
| State1 | 2025 | 2026 | Change | Notable Trends |
|---|---|---|---|---|
| Florida | 64 | 108 | 44 | Leads new plan activity |
| Texas | 55 | 77 | 22 | Led in SAE (31 plans) and SAR (56) renewals |
| California | 52 | 58 | 6 | Led Initial Contracts with Louisiana (11 plans) |
| Pennsylvania | 54 | 55 | 1 | Overtook California and leads in Consolidated renewal plans |
| New York | 26 | 43 | 17 | Only New and SAR plans have upward moment. |
SAR activity is high in below states
| State | 2025 Plans | 2026 Plans | Change | |
|---|---|---|---|---|
| Michigan | 23 | 48 | 25 | |
| Pennsylvania | 21 | 46 | 25 | |
| Ohio | 23 | 44 | 21 | |
| Iowa | 13 | 28 | 15 | |
| Georgia | 35 | 48 | 13 | |
| Indiana | 41 | 16 | -25 | |
| North Carolina | 38 | 14 | -24 | |
| Kentucky | 36 | 20 | -16 | |
| Alabama | 28 | 13 | -15 | |
| Tennessee | 20 | 8 | -12 |
Vermont and Puerto Rico have no SAR renewal plans
Why the South Is Accelerating While the West Stabilizes
Southern Growth Drivers:
- Demographic advantage: Rapid Medicare-eligible population growth in states like Texas, Florida, and Georgia
- Regulatory environment: Generally more favorable state regulatory frameworks and reimbursement structures
- Lower saturation: Room for expansion compared to mature markets
- Provider collaboration: Strong payor-provider partnerships enabling network growth
Western/Upper Midwest Headwinds:
- Market maturity: Highly penetrated markets like California leave little room for growth
- Margin pressure: Higher cost structures and regulatory complexity in states like Vermont, Minnesota
- Competition intensity: Established players defending market share aggressively
- Star Ratings challenges: Payors exiting underperforming markets to protect overall ratings
Market Concentration Risk
The concentration of growth in select southern states while two-thirds of states experience decline raises concerns about beneficiary access disparities. Notably, apart from California, none of the top-performing states recorded Initial Contracts, and Wyoming and Hawaii continued to have no New Plans, highlighting the uneven regional distribution of Medicare Advantage growth
3. MA-Only vs MAPD: The Great Divergence
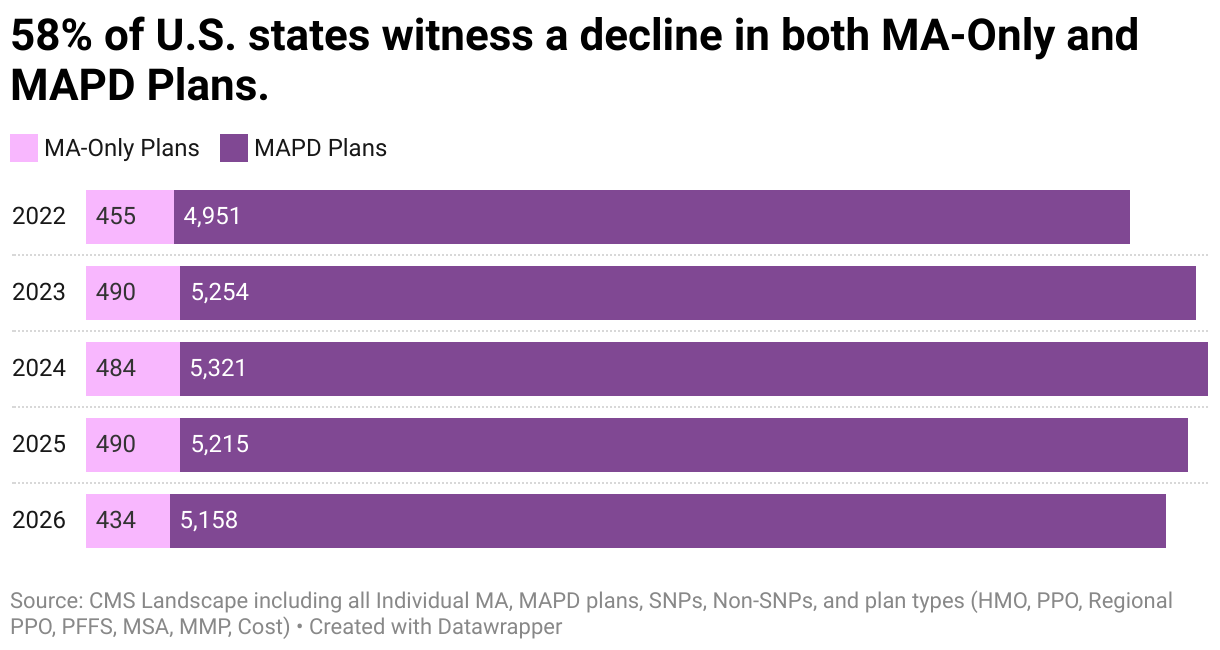
The 2026 landscape reveals a decisive shift toward integrated coverage models. While MA-Only plans face sharp contraction (-11.4% YoY), MAPD plans demonstrate resilience, maintaining 92% of total market share with 5,158 offerings. This divergence reflects both beneficiary preference for comprehensive coverage and payor-driven portfolio simplification.
MA-Only Plans: Accelerating Decline
| Year | MA-Only Plans | Change | YoY |
|---|---|---|---|
| 2022 | 455 | - | - |
| 2023 | 490 | 35 | 7.7% |
| 2024 | 484 | -6 | -1.2% |
| 2025 | 490 | 6 | 1.2% |
| 2026 | 434 | -56 | -11.4% |
Key Metrics (2026)
Total Plans:
Market Share:
New Plans:
(-44% YoY)
New Plans Share:
Leading State:
Wisconsin
Second:
Texas
MA-Only plans experienced their steepest decline in recent years, dropping 11.4% YoY to just 434 plans in 2026. This marks a dramatic reversal from the expansion through 2023-2024, highlighting growing consolidation among standalone MA products as payors streamline portfolios.
Payor Movements in MA-Only
- Humana Inc.: Maintained modest growth, reaching 89 plans
- Health Care Service Corporation (HCSC): Largest percentage increase, expanding from 4 to 15 plans
- UnitedHealth Group: Dropped by 1 plan
- CVS Health: Contracted by 7 plans (-15%)
New plan activity registered a sharp 44% year-over-year drop, with new plans accounting for only 6.5% of the total MA-Only portfolio—indicating severely limited expansion appetite in standalone medical plans.
MA-Only Plan Composition (2026)
| Category | 2025 | 2026 | Change | Share 2026 | Trend |
|---|---|---|---|---|---|
| Renewal Plan | 289 | 265 | -24 | 61.1% | Slight increase in share |
| Renewal Plan with SAR | 89 | 88 | -1 | 20.3% | Growing traction ▲ |
| Renewal Plan with SAE | 53 | 42 | -11 | 9.7% | Sharp drop ▼ |
| New Plan | 48 | 27 | -21 | 6.2% | Declining ▼ |
| Consolidated Renewal Plan | 9 | 11 | 2 | 2.5% | Minimal activity |
| Initial Contract | 2 | 1 | -1 | 0.2% | Stable |
MAPD Plans: Resilient Market Leader
| Year | MAPD Plans | Change | YoY |
|---|---|---|---|
| 2022 | 4,951 | - | - |
| 2023 | 5,254 | 303 | 6.1% |
| 2024 | 5,321 | 67 | 1.3% |
| 2025 | 5,215 | -106 | -2.0% |
| 2026 | 5,158 | -57 | -1.1% |
Key Metrics (2026)
Total Plans:
Market Share:
New Plans:
(+124 )
New Plans Share:
Leading State:
Florida
+4% YoY
Second:
Texas
+11% YoY
In sharp contrast to MA-Only, MAPD plans remained relatively resilient, with total offerings dipping slightly by 57 plans with 1.1% YoY decline. The segment’s steady performance—underscores the market’s strategic pivot toward comprehensive medical and drug coverage, reflecting both beneficiary preference and payor-driven simplification.
Payor Movements in MAPD
- Humana Inc.: Led expansion with 90 plans added
- Devoted Health: Nearly doubled MAPD portfolio from 223 to 415 plans (+86%), signaling aggressive market capture
- UnitedHealth Group: Scaled back modestly in strategic realignment
- CVS Health: Reduced offerings, focusing on performance optimization
- Elevance Health: Strategic contraction to strengthen core markets
MAPD new plans continued dominating with steady growth—124 additions in 2026 reaching a total of 884. These new plans account for 17% of all MAPD offerings, highlighting strong expansion and sustained carrier focus on integrated medical and drug coverage options.
MAPD Plan Composition (2026)
| Category | 2025 | 2026 | Change | Share 2026 | Trend |
|---|---|---|---|---|---|
| Renewal Plan | 3,139 | 2,968 | -171 | 57.5% | Moderating from 60% |
| New Plan | 685 | 770 | 85 | 14.9% | Robust expansion ▲ |
| Renewal Plan with SAR | 567 | 657 | 90 | 12.7% | Advancing ▲ |
| Renewal Plan with SAE | 471 | 378 | -93 | 7.3% | Rapid decline |
| Consolidated Renewal Plan | 278 | 271 | -7 | 5.3% | Stable |
| Initial Contract | 75 | 114 | 39 | 2.2% | Modest increase ▲ |
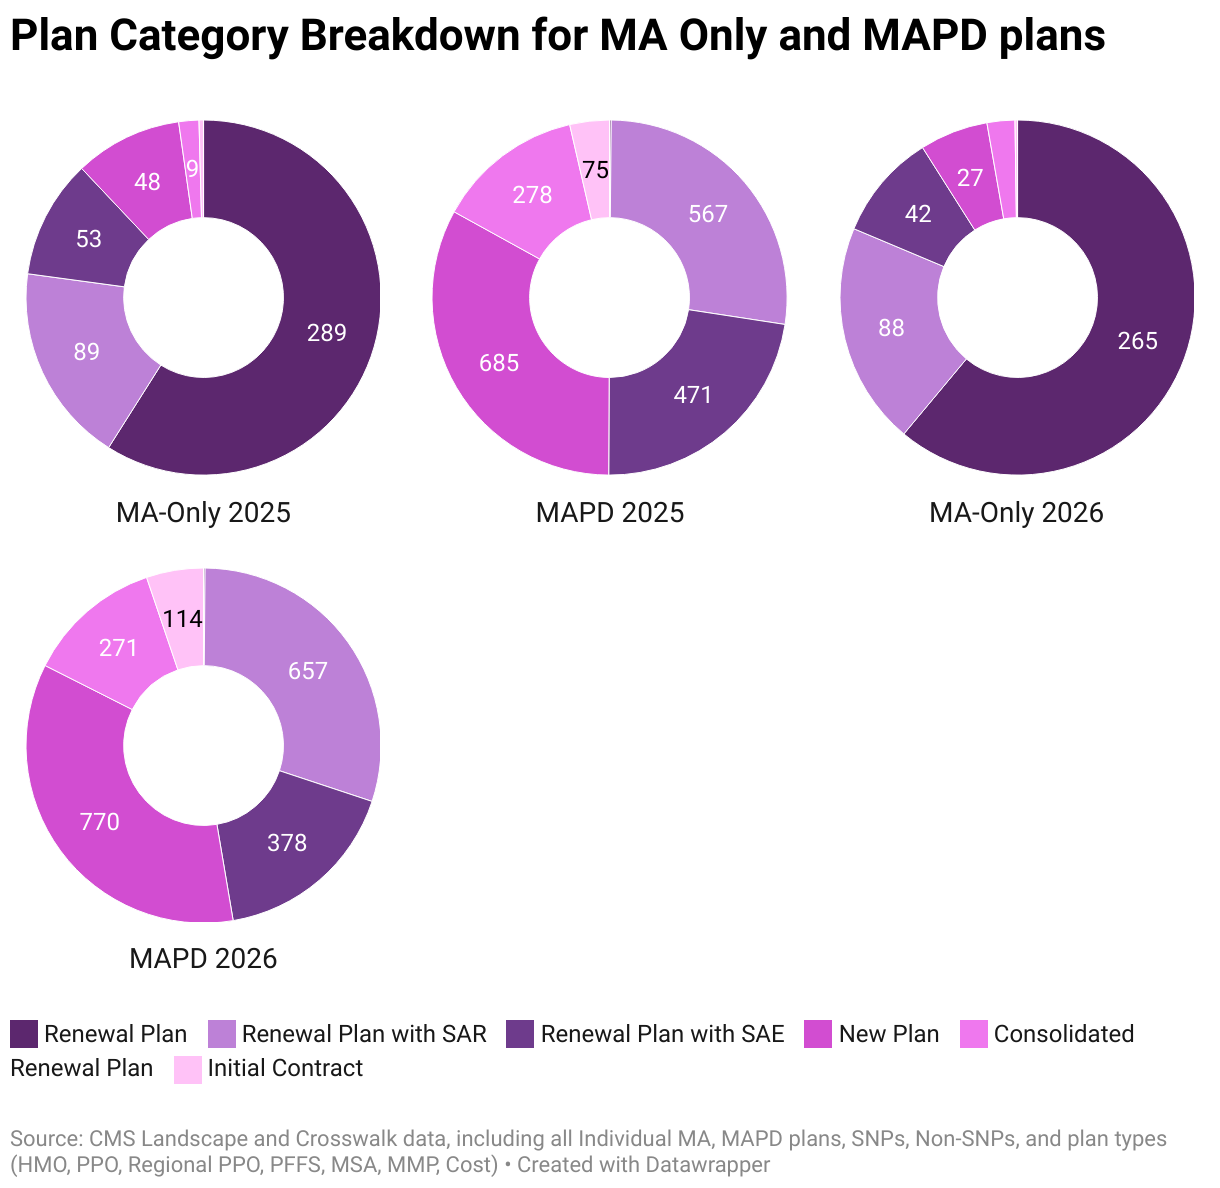
Plan category concentration
In 2026, both MA-Only and MAPD segments showed clear contrasts in market direction. MA-Only plans remained heavily renewal-driven, with Renewal Plans rising slightly to 61% while New Plans dropped sharply from 48 to 27, reducing their share to 6.2%. Renewal Plans with SAR continued gaining traction, growing to 20.3%, even as SAE plans declined further to 378 from 471. Meanwhile, MAPD plans demonstrated stronger diversification—Renewal Plans moderated from 60.2% to 57.5%, but New Plans surged to 770 (14.9% share), marking robust expansion. SAR renewals also advanced from 567 to 657, and Initial Contracts doubled in share to 2.2%.
Strategic Implications
Why MAPD Dominates:
- Beneficiary preference: Simplified enrollment and single-plan convenience drive demand
- Part D integration: Bundled drug coverage essential for chronic condition management
- Operational efficiency: Easier for payors to manage single integrated product
- Competitive advantage: Comprehensive benefits packages more attractive in crowded markets
- Star Ratings synergy: Integrated care coordination improves quality metrics
MA-Only Outlook: The accelerating decline suggests this segment may become increasingly niche, serving specific populations who obtain Part D coverage separately or through employer-sponsored plans. Expect continued consolidation through 2027-2028.
4. Special Needs Plan (SNP) Performance: The Twin Engines of Growth
The 2026 SNP landscape reveals dramatic divergence across plan types. While D-SNP and C-SNP plans emerge as powerful growth engines (+14.8% and +42% respectively), Non-SNP and I-SNP offerings contract as payors reallocate resources toward specialized, high-acuity populations. This bifurcation signals a fundamental shift toward purposeful, value-based care delivery targeting complex beneficiary needs.
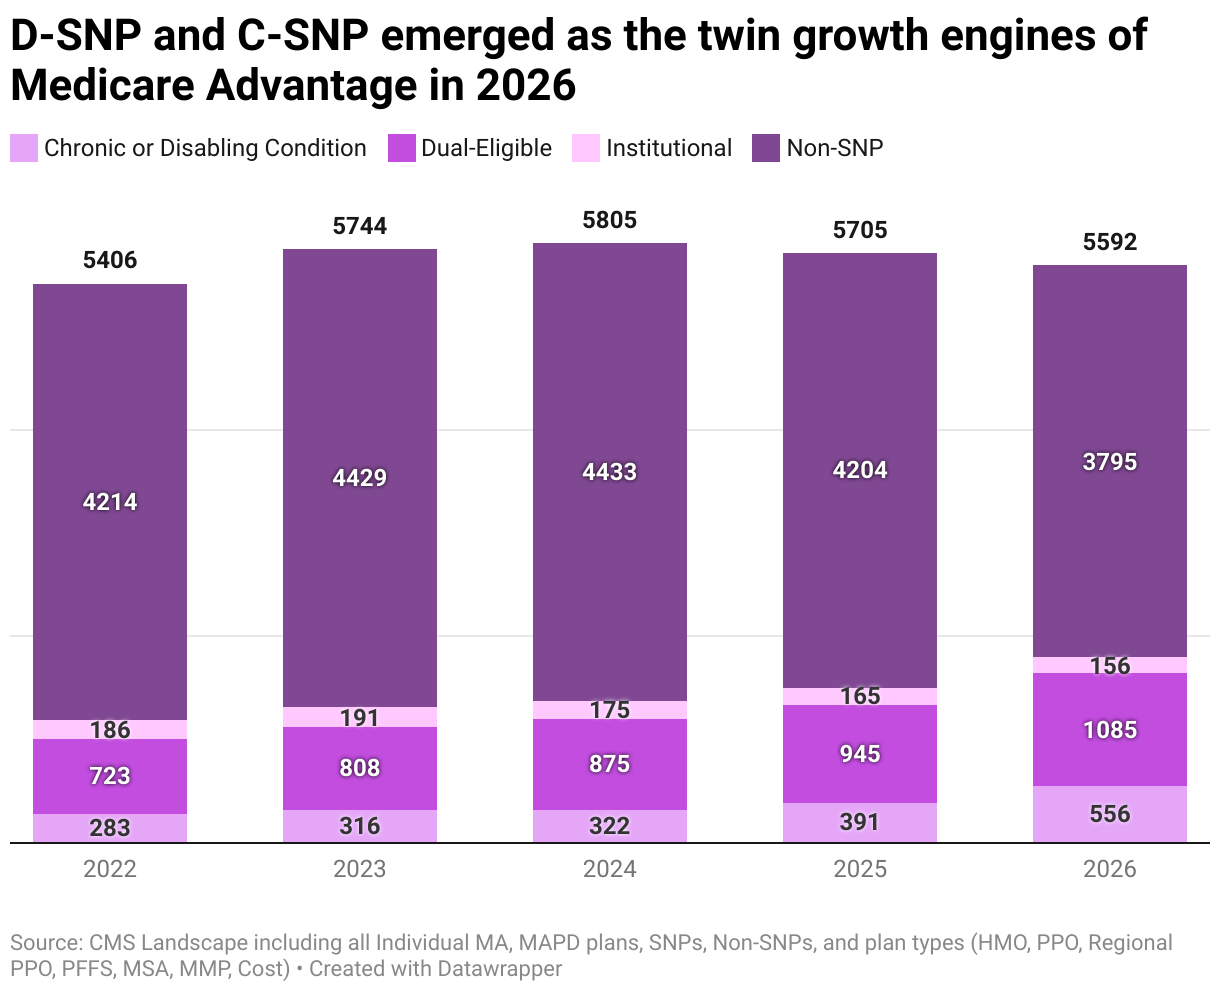
D-SNP Plans
+14.8% YoY
C-SNP Plans
+42% YoY
Non-SNP Plans
-9.7% YoY
I-SNP Plans
-5.5% YoY
Non-SNP: Market Correction Continues
| Metric | 2025 | 2026 | Change |
|---|---|---|---|
| Total Plans | 4,204 | 3,795 | -409 (-9.7%) |
| $0 Premium Plans | 2,864 | 2,563 | -301 (-10.5%) |
| $0 Premium % | 68.2% | 67.6% | -0.6 pp |
| HMO Plans | 2,296 | 2,139 | -157 (-6.8%) |
| PPO Plans | 1,762 | 1,553 | -209 (-11.9%) |
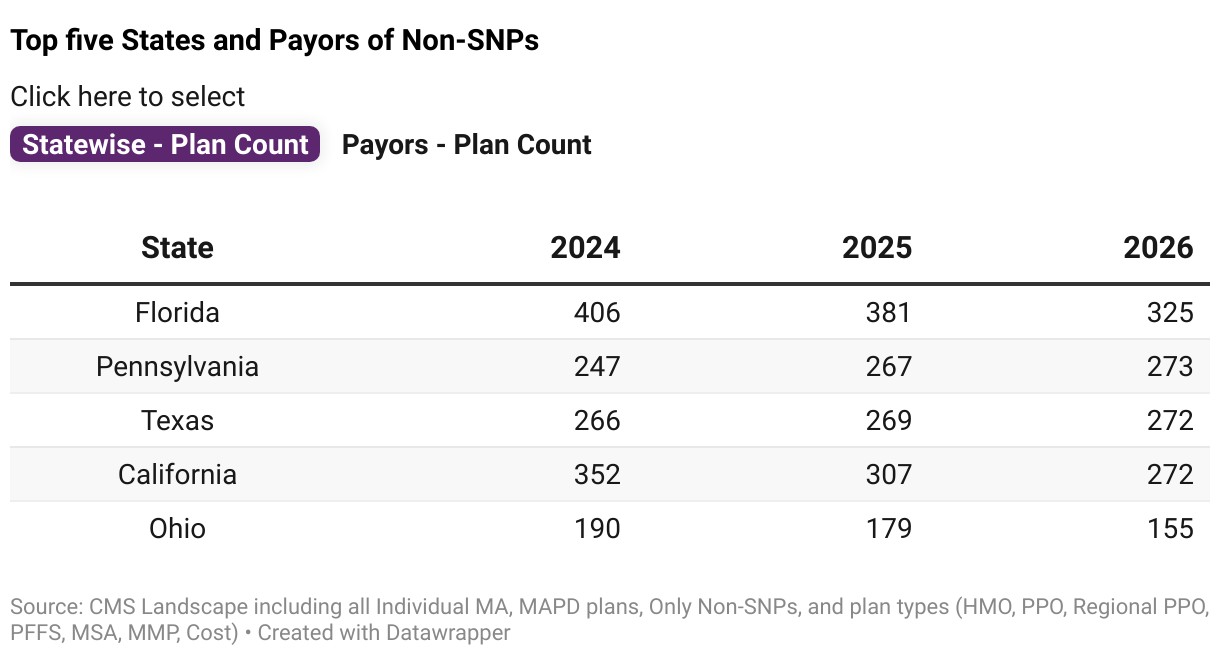
Market Rationalization
The Non-SNP segment, traditionally the largest in volume, has entered a phase of correction after years of aggressive expansion. Plan counts declined for the second consecutive year, down 9.7% YoY to 3,795 in 2026.
Key trends:
- Over 76% of states experienced declines
- HMO offerings comprise 56% (2,139 plans)
- PPO plans show steeper decline trajectory
Top Markets: Florida (325 plans) and Pennsylvania (273 plans) remain key markets, but both experienced declines as payors streamline offerings.
Payor Activity: Major players like UnitedHealth, CVS Health, and HCSC scaled back Non-SNP offerings, even as Humana and Devoted expanded selectively in high-performing markets.
Non-SNP Plan Composition (2026)
| Category | 2025 | 2026 | Share 2026 |
|---|---|---|---|
| Consolidated Renewal Plan | 228 | 202 | 5.3% |
| Initial Contract | 56 | 46 | 1.2% |
| New Plan | 460 | 428 | 11.3% |
| Renewal Plan | 2,587 | 2,262 | 59.6% |
| Renewal Plan with SAE | 348 | 265 | 7.0% |
| Renewal Plan with SAR | 525 | 592 | 15.6% |
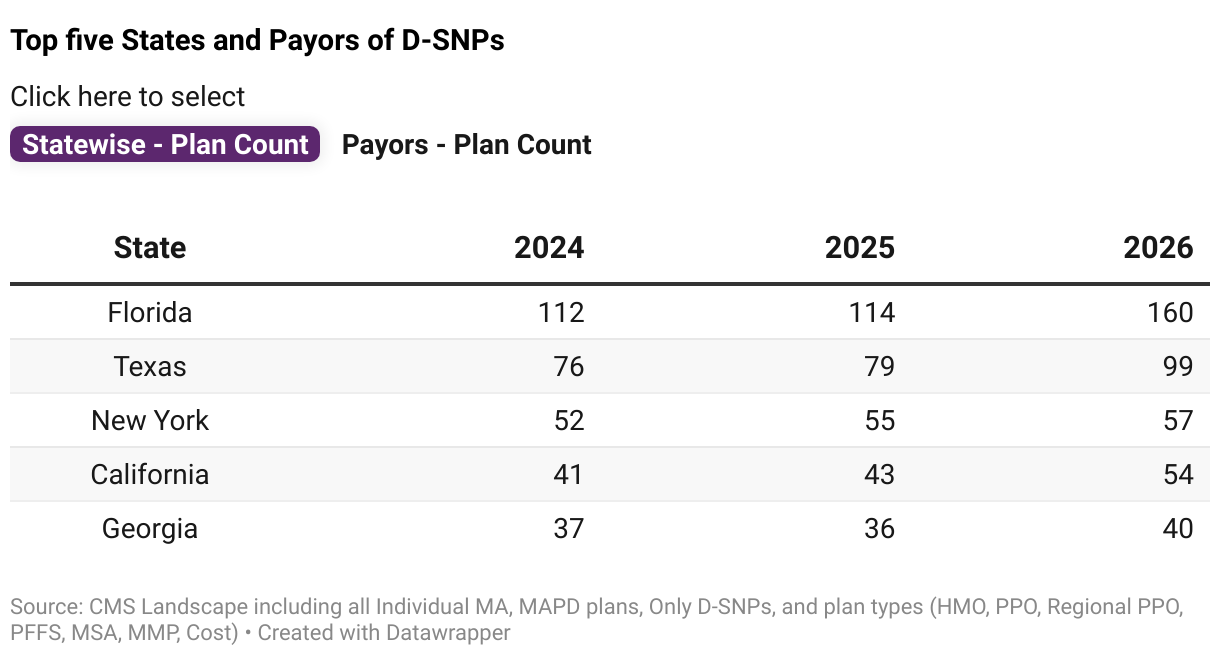
D-SNP: Fastest-Growing Segment
Dual-Eligible Focus Accelerates
D-SNPs continued their strong upward trajectory, cementing their position as the fastest-growing segment with total plans surging 14.8% YoY to 1,085. Growth is driven by policy focus on integrated care for dual-eligible beneficiaries
| Metric | 2025 | 2026 | Change |
|---|---|---|---|
| Total Plans | 945 | 1,085 | +140 (+14.8%) |
| $0 Premium Plans | 664 | 863 | +199 (+30%) |
| $0 Premium % | 70.3% | 80.0% | +9.7 pp |
| HMO Plans | 780 | 909 | +129 (+16.5%) |
| Local PPO Plans | 163 | 174 | +11 (+6.7%) |
Top Payor Growth
- Humana Inc.: Strongest expansion among major payors (+27% YoY, +31 plans)
- UnitedHealth: 185 → 196 plans (+11 plans)
- Centene: Aggressive expansion (+21% YoY)
D-SNP Plan Composition (2026)
| Description | 2025 | 2026 | Share 2026 | Trend |
|---|---|---|---|---|
| Consolidated Renewal Plan | 42 | 67 | 6.2% | Stable contribution |
| Initial Contract | 15 | 44 | 4.1% | Strong addition ▲ |
| New Plan | 151 | 168 | 15.5% | Stable contribution |
| Renewal Plan | 553 | 625 | 57.6% | Continued leadership ▲ |
| Renewal Plan with SAE | 92 | 76 | 7.0% | Only decline ▼ |
| Renewal Plan with SAR | 92 | 105 | 9.7% | Growing segment ▲ |
D-SNP Growth Drivers
- Policy Support: Federal and state push for integrated care models
- Financial Alignment: Enhanced state partnership opportunities through Medicaid integration
- Market Opportunity: Dual-eligible beneficiaries represent significant untapped potential
- $0 Premium Dominance: 80% of D-SNPs now offer $0 premiums, up from 70% in 2025
- HMO Preference: 83% market share (909 plans) reinforces coordinated care model success
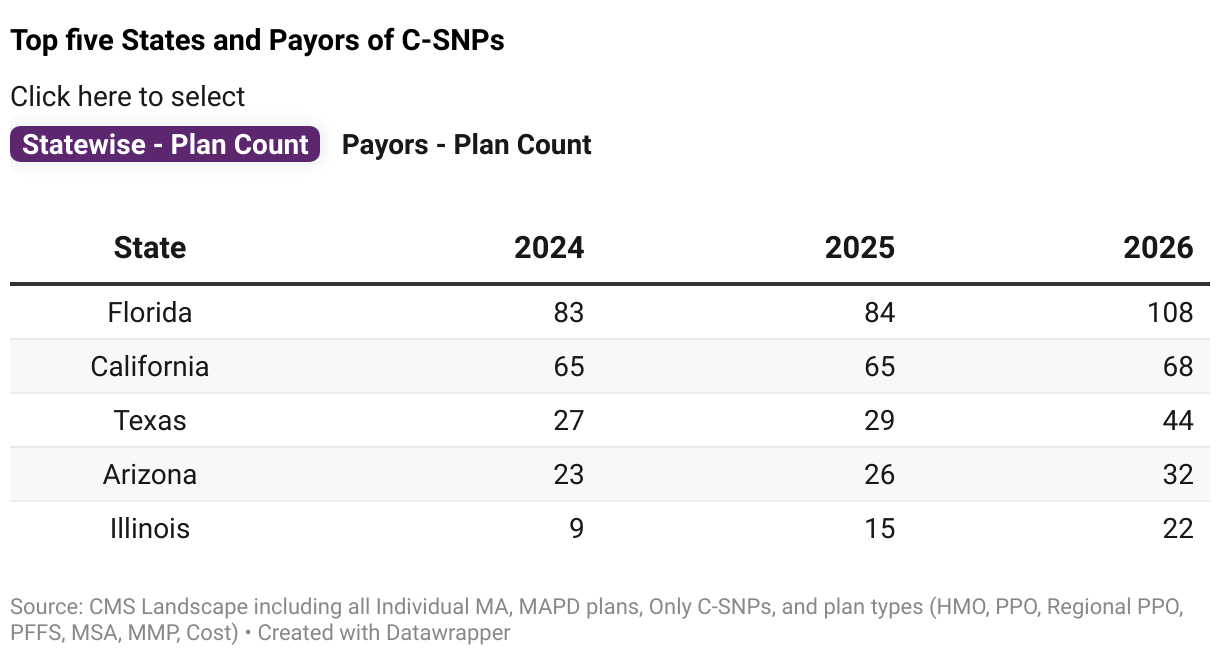
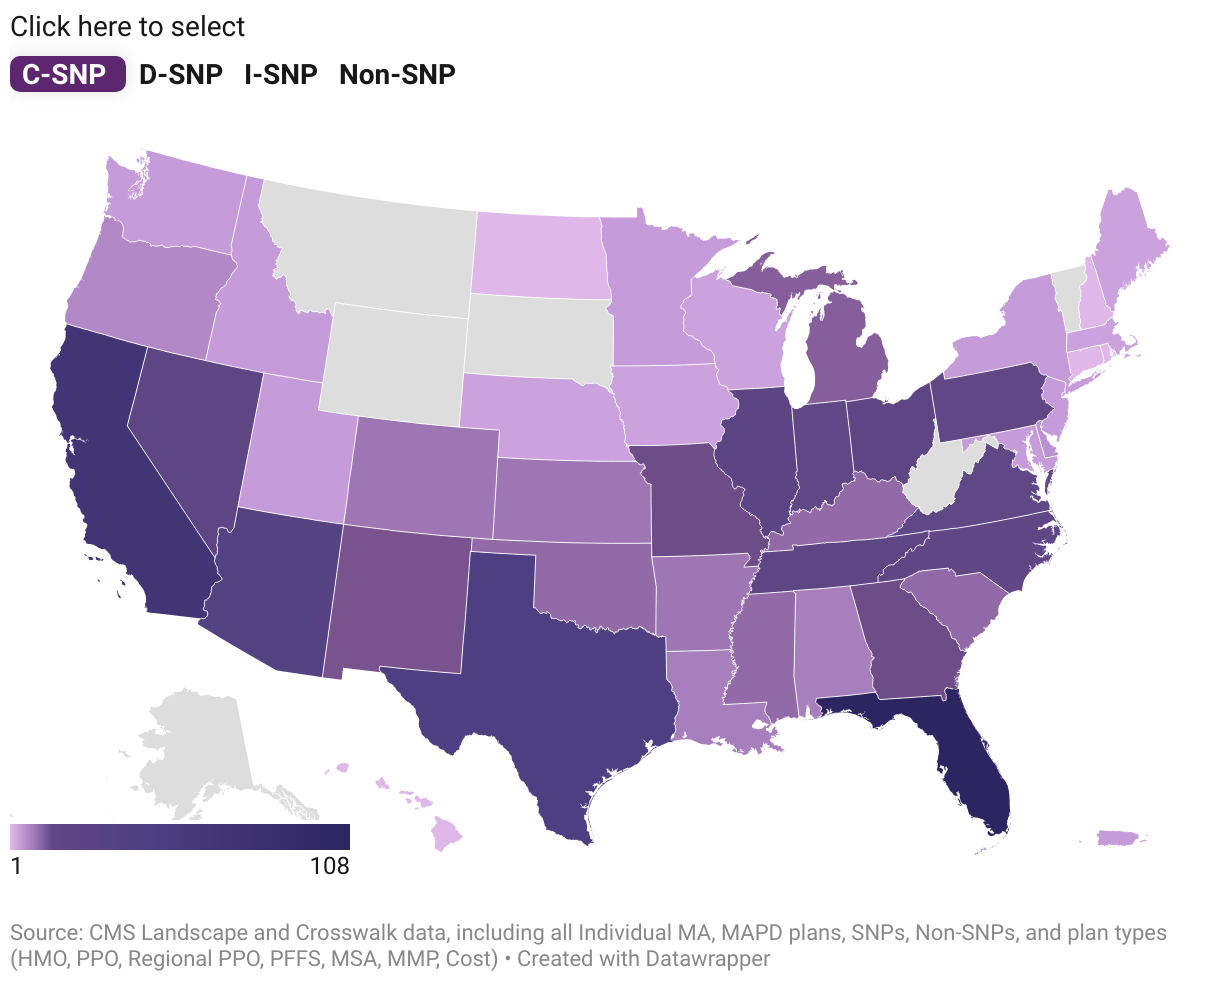
C-SNP: The Breakout Star of 2026
Dramatic Expansion: Nearly Doubling in One Year
The C-SNP segment emerged as the standout growth story of 2026, reaching 556 plans with an impressive 42% YoY increase from 2025. Since 2022, the segment has nearly doubled, reflecting surging payor interest in chronic condition management as a profitable, high-value market.
| Metric | 2025 | 2026 | Change |
|---|---|---|---|
| Total Plans | 391 | 556 | +165 (+42%) |
| $0 Premium Plans | 309 | 367 | +58 (+18.8%) |
| $0 Premium % | 79.0% | 66.0% | -13.0 pp |
| HMO Plans | 348 | 455 | +107 (+31%) |
| Local PPO Plans | 37 | 96 | +59 (+159%) |
Geographic Leaders
Disruptor Payor Activity
- Texas: +52% YoY
- Illinois: +47% YoY
- Florida: +24 plans
- Expansion: Widespread across multiple states
- Devoted Health: 4 plans (2024) → 122 plans (2026)
- CVS Health: Rapid category entry
- Strategy: Dual approach—coordinated HMO care + flexible PPO acces
C-SNP Plan Composition (2026)
| Description | 2025 | 2026 | Share 2026 | Trend |
|---|---|---|---|---|
| Consolidated Renewal Plan | 17 | 13 | 2.3% | -4 plans ▼ |
| Initial Contract | 0 | 23 | 4.1% | New entry signal ▲ |
| New Plan | 104 | 194 | 34.9% | Nearly doubled ▲▲ |
| Renewal Plan | 216 | 267 | 48.0% | Strong growth ▲ |
| Renewal Plan with SAE | 39 | 28 | 5.0% | -11 plans ▼ |
| Renewal Plan with SAR | 15 | 31 | 5.6% | +16 plans ▲ |
Why C-SNP Is Exploding
- Market Size: Medicare beneficiaries have various chronic conditions (diabetes, heart disease, etc)
- Value-Based Care: C-SNPs enable targeted disease management with enhanced reimbursement
- Clinical Outcomes: Specialized care coordination improves Star Ratings and reduces hospitalizations
- Payor Innovation: New entrants like Devoted Health see C-SNP as differentiation opportunity
- Regulatory Support: CMS encourages specialized plans for complex populations
- Flexible Models: Both HMO (+31% YoY) and PPO (+159% YoY) structures thriving
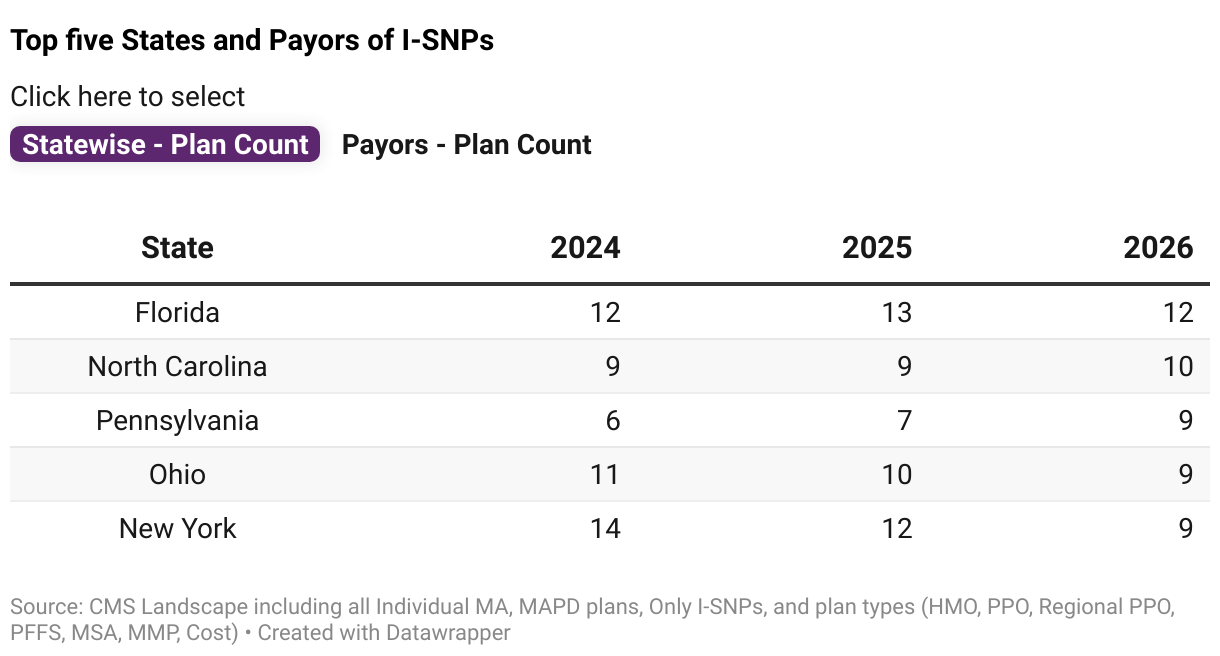
I-SNP: Continued Contraction in Niche Segment
Third Consecutive Year of Decline
The I-SNP market continued its gradual retreat, falling to 156 plans (-5.5% YoY) in 2026—marking its third straight year of decline. This institutional segment faces unique operational challenges, limited market size, and uncertain profitability dynamics.
| Metric | 2025 | 2026 | Change |
|---|---|---|---|
| Total Plans | 165 | 156 | -9 (-5.5%) |
| $0 Premium Plans | 41 | 33 | -8 (-19.5%) |
| $0 Premium % | 24.8% | 21.2% | -3.6 pp |
| HMO Plans | 117 | 110 | -7(- 6.0%) |
| Local PPO Plans | 48 | 46 | -2 (-4.2%) |
Decline States
Growth Pockets
- New York: -25% YoY
- Ohio: -10% YoY
- Florida: -8% YoY
- Minnesota: Exited market entirely
Pennsylvania, North Carlina, California and Washington noticed modest gains.
Payor Activity: UnitedHealth Group recorded the sharpest drop (-26% YoY), while Rifkin Managed Care grew slightly (+6% YoY). Humana, Mitchell Family Office, and Curana Health remained stable, indicating selective participation in this challenging segment.
I-SNP Plan Composition (2026)
| Category | 2025 | 2026 | Share 2026 |
|---|---|---|---|
| Initial Contract | 6 | 2 | 1.3% |
| New Plan | 18 | 7 | 4.5% |
| Renewal Plan | 72 | 79 | 50.6% |
| Renewal Plan with SAE | 45 | 51 | 32.7% |
| Renewal Plan with SAR | 24 | 17 | 10.9% |
I-SNP Challenges
- Limited Market: Serves institutionalized beneficiaries in nursing homes, long-term care facilities
- Operational Complexity: High-acuity population requires intensive care coordination
- Reimbursement Pressure: Narrow margins make profitability challenging
- Low Premium Penetration: Only 21% offer $0 premiums (vs 80% for D-SNP)
- Regulatory Burden: Strict oversight and quality requirements
- Slow Market Entry: New plan activity softened marginally, reflecting cautious expansion
5. Plan Type Dynamics: HMO Dominance vs PPO Retrenchment
The 2026 plan type landscape crystallizes a fundamental market shift: HMO plans are strengthening their grip on the Medicare Advantage market, now commanding 65% share, while PPO offerings face broad-based contraction. This divergence reflects payor prioritization of cost-efficient, coordinated care models over higher-cost, flexible network structures.
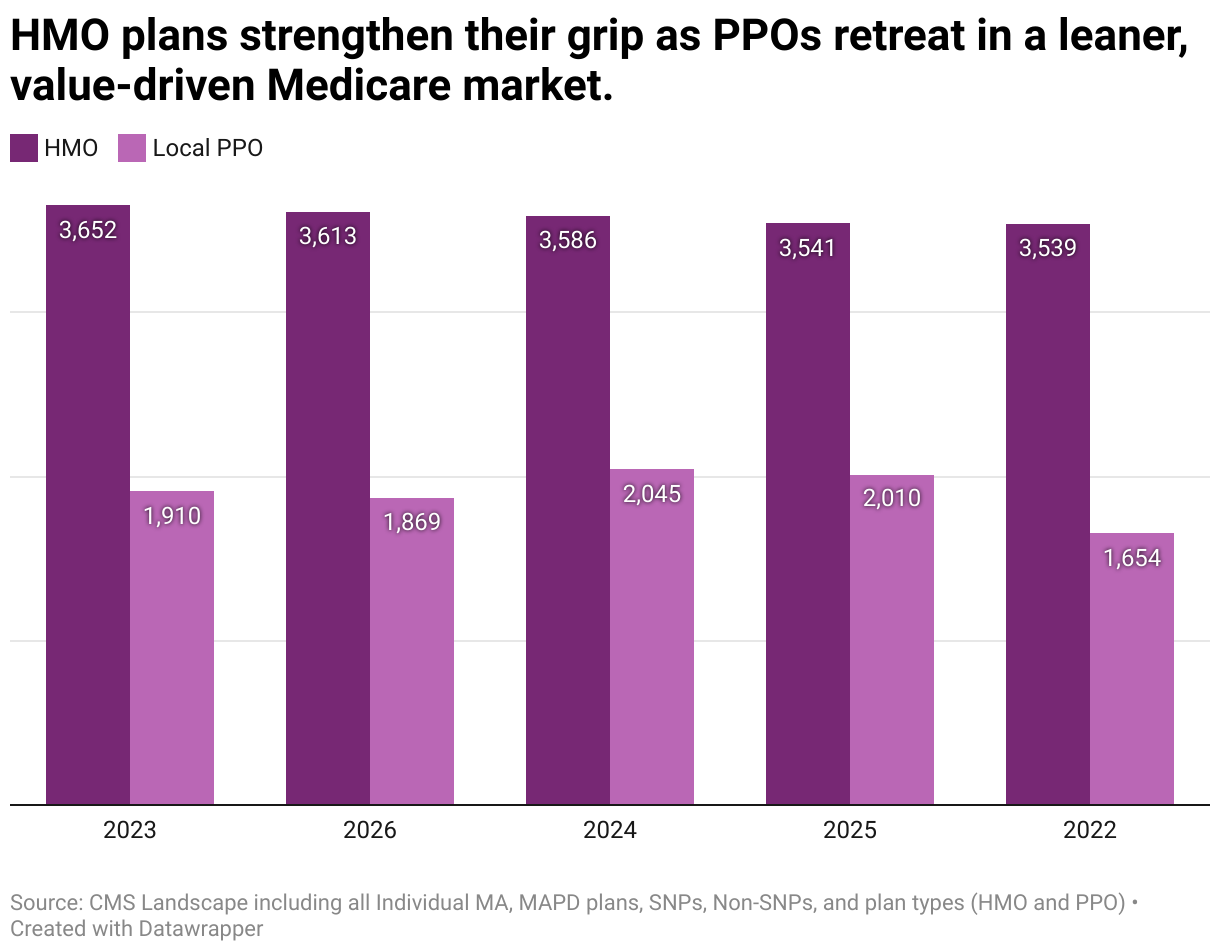
HMO Plans: The Value-Based Care Champion
Sustained Growth: HMO Plans Reach 65% Market Share
HMO plans grew modestly by 2% YoY, rising from 3,541 to 3,613 in 2026, now accounting for 65% of all Medicare Advantage offerings. This sustained dominance highlights continued market shift toward cost-efficient, integrated care models emphasizing stability, coordination, and value-based outcomes.
| Metric | 2025 | 2026 | Change |
|---|---|---|---|
| Total Plans | 3541 | 3613 | +72 (+2%) |
| Market Share | 62.1% | 64.6% | +2.5 pp |
| $0 Premium Plans | 2547 | 2656 | +109 (4.3%) |
| $0 Premium % | 71.9% | 73.5% | +1.6pp |
Top Growth States
Payor Leaders
- Pennsylvania: +26.5% YoY
- Texas: +17.2% YoY
- Florida: +3.2% YoY
- Devoted Health: +78.4% YoY
- Humana: +5.4% YoY
- CVS Health: +3.6% YoY
HMO Plan Composition (2026)
| Category | 2025 | 2026 | Share 2026 | Tred |
|---|---|---|---|---|
| Consolidated Renewal Plan | 191 | 187 | 5.2% | Stable |
| Initial Contract | 28 | 67 | 1.9% | +39 plans ▲ |
| New Plan | 425 | 528 | 14.6% | Significant increase ▲ |
| Renewal Plan | 2,280 | 2,218 | 61.4% | Dominant but declining count |
| Renewal Plan with SAE | 369 | 261 | 7.2% | Declined -104 plans ▼ |
| Renewal Plan with SAR | 248 | 352 | 9.7% | Notable growth ▲ |
Why HMO Plans Continue to Win
- Cost Efficiency: In-network care coordination reduces medical costs vs PPO models
- Star Ratings Advantage: Better care management improves quality metrics and bonus payments
- Beneficiary Value: Lower premiums and predictable costs appeal to price-sensitive beneficiaries
- Provider Partnerships: Strong network relationships enable value-based contracting
- Regulatory Alignment: CMS policies favor coordinated, accountable care models
- SNP Synergy: HMO structure ideal for D-SNP (25%) and C-SNP (13%) specialized populations.
PPO Plans: Broad-Based Retreat
PPO Contraction Accelerates
The PPO segment saw broad-based declines in 2026, with Local PPOs dropping 7% YoY (2,010 → 1,869) and Regional PPOs falling 12% (51 → 45), signaling retrenchment from higher-cost, flexible structures as payors focus on profitability and operational efficiency.
| Metric | 2025 | 2026 | Change |
|---|---|---|---|
| Total Plans | 2,010 | 1,869 | -141 (-7.2%) |
| Market Share | 35.2% | 33.4% | -1.8 pp |
| $0 Premium Plans | 1,274 | 1,142 | -132(10.4%) |
| $0 Premium % | 63.4% | 61.1% | -2.3pp |
Steepest Decline States
Counter-Trend Payors
Disclaimer:
This analysis presents insights based on individual MA and MAPD plans for 2026. Data points are shown at the CPID level to account for overlapping crosswalk descriptions. As a result, figures at the Bid ID level may show minor variations. These differences are expected and do not impact the overall accuracy, validity, or interpretation of the insights presented.
Why HealthworksAI
Be first. Be right. (Not either/or)
Fastest signal → action
- Landscape <36h, PBP/Crosswalk 48h
- Enrollment Forecast 96h (91.2% benchmark)

County precision, not averages
- Defend/Grow/Shrink maps, broker targets
- One-pagers so field teams act where shelf space just opened

Benefits that actually convert
- Benefit sensitivity quick-tests by ZIP (Rx, dental $, flex, utilities) to reallocate budget from low-ROI perks to high-lift levers

20-min readout: top counties, rival moves, benefit levers, commission signals.
Insights from CMS Landscape (<36h turnaround)