Demystifying
Medicare Advantage
The Growth of $0 Premium Plans in Medicare Advantage
March 24, 2022 Whitepaper
Executive Summary
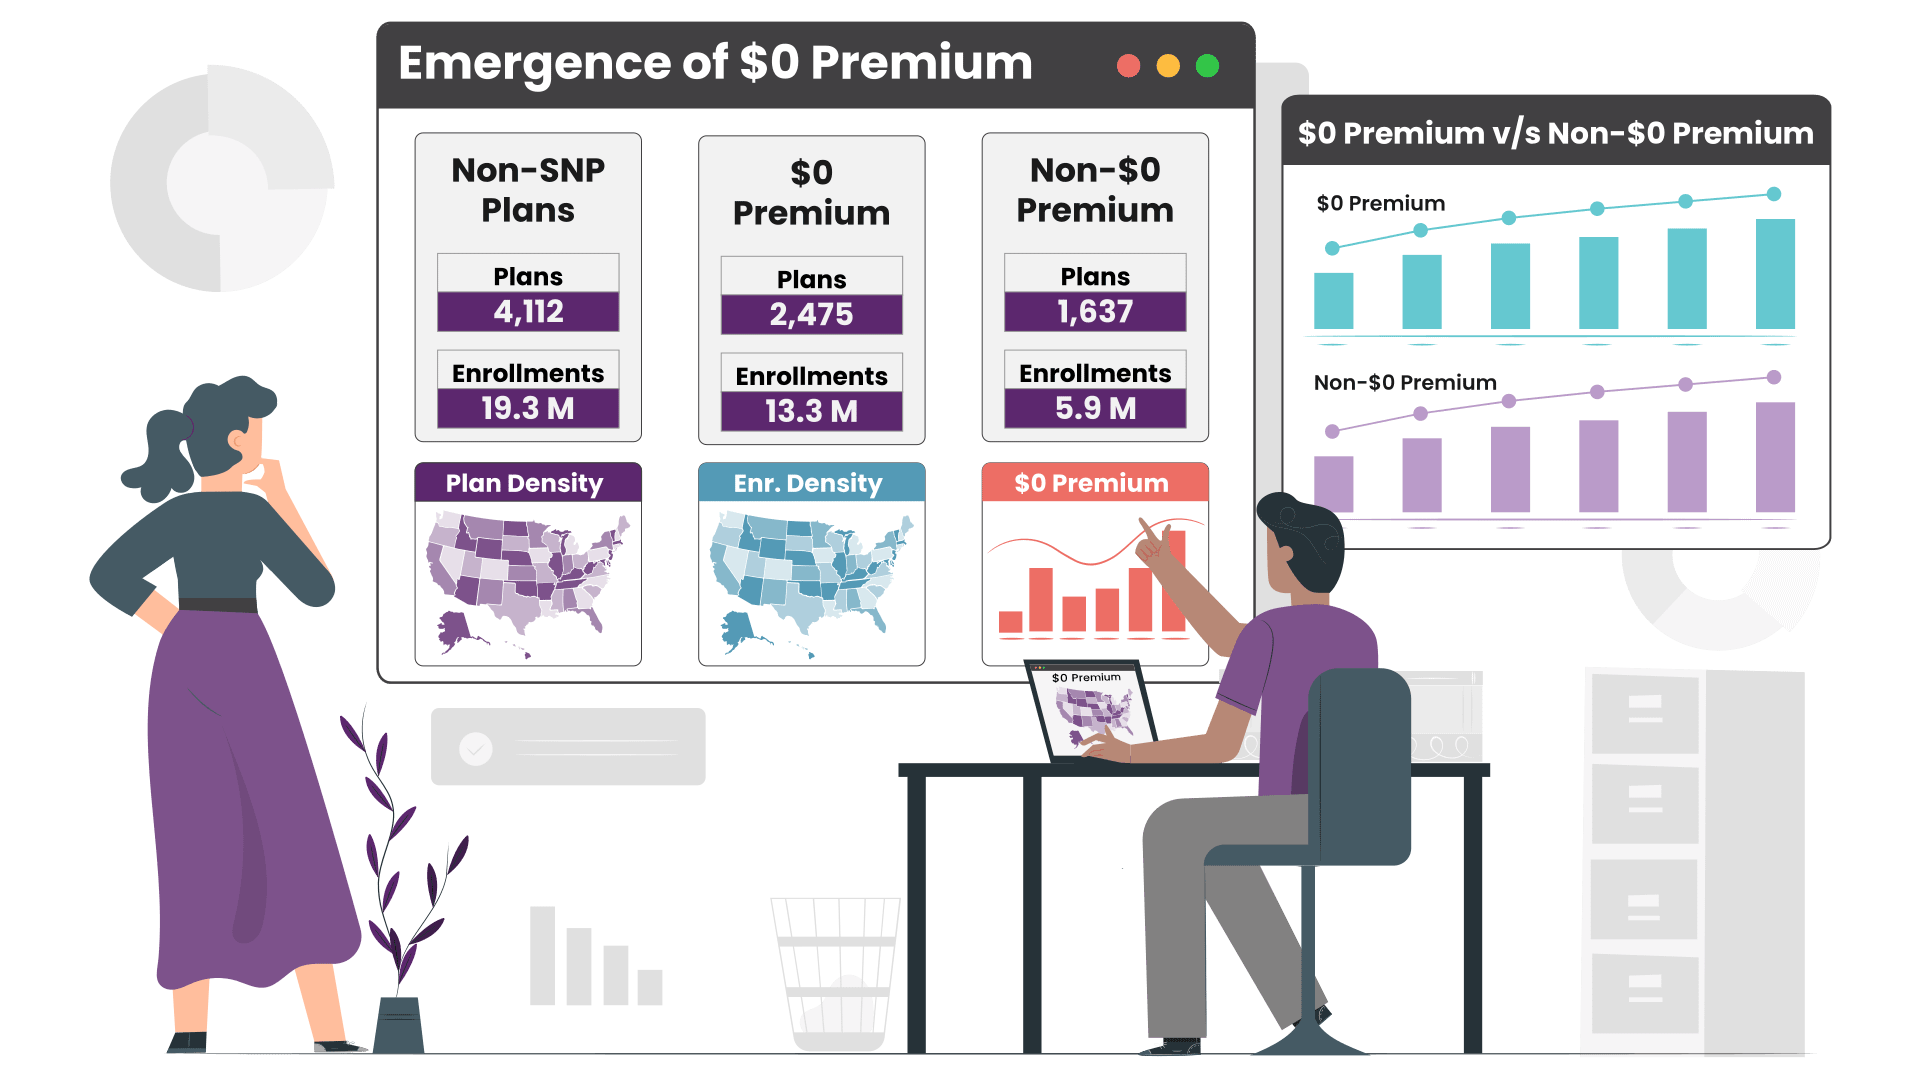
Over the years, $0 Premium Plans have shown a steady growth in the number of enrollments captured. With year-on-year increasing market share, $0 Premium Plans have caught the attention of both the insurance providers and the beneficiaries alike. As of February 2022, $0 Premium Non-SNP Plans hold almost 56% of enrollments across the entire Medicare Advantage (MA) market whereas Non-$0 Premium Non-SNP Plans hold approximately 25%. This difference in market share tantamount to 7.4M beneficiaries and it has been constantly increasing over the last 5 years.
In 2022, $0 Premium Plans continue their year-over-year (YoY) enrollment growth in PPO category at 35.5% while HMO saw a drop in growth compared to 2021. There exist regional variations as well, which this paper helps you unravel through the interactive charts; for instance, Weighted Averages of Annual Drug Deductible, OOPC and MOOP are lower for $0 Premium Plans compared to Non – $0 Premium Plans across markets such as Florida, California and Texas.
Landscape 2022
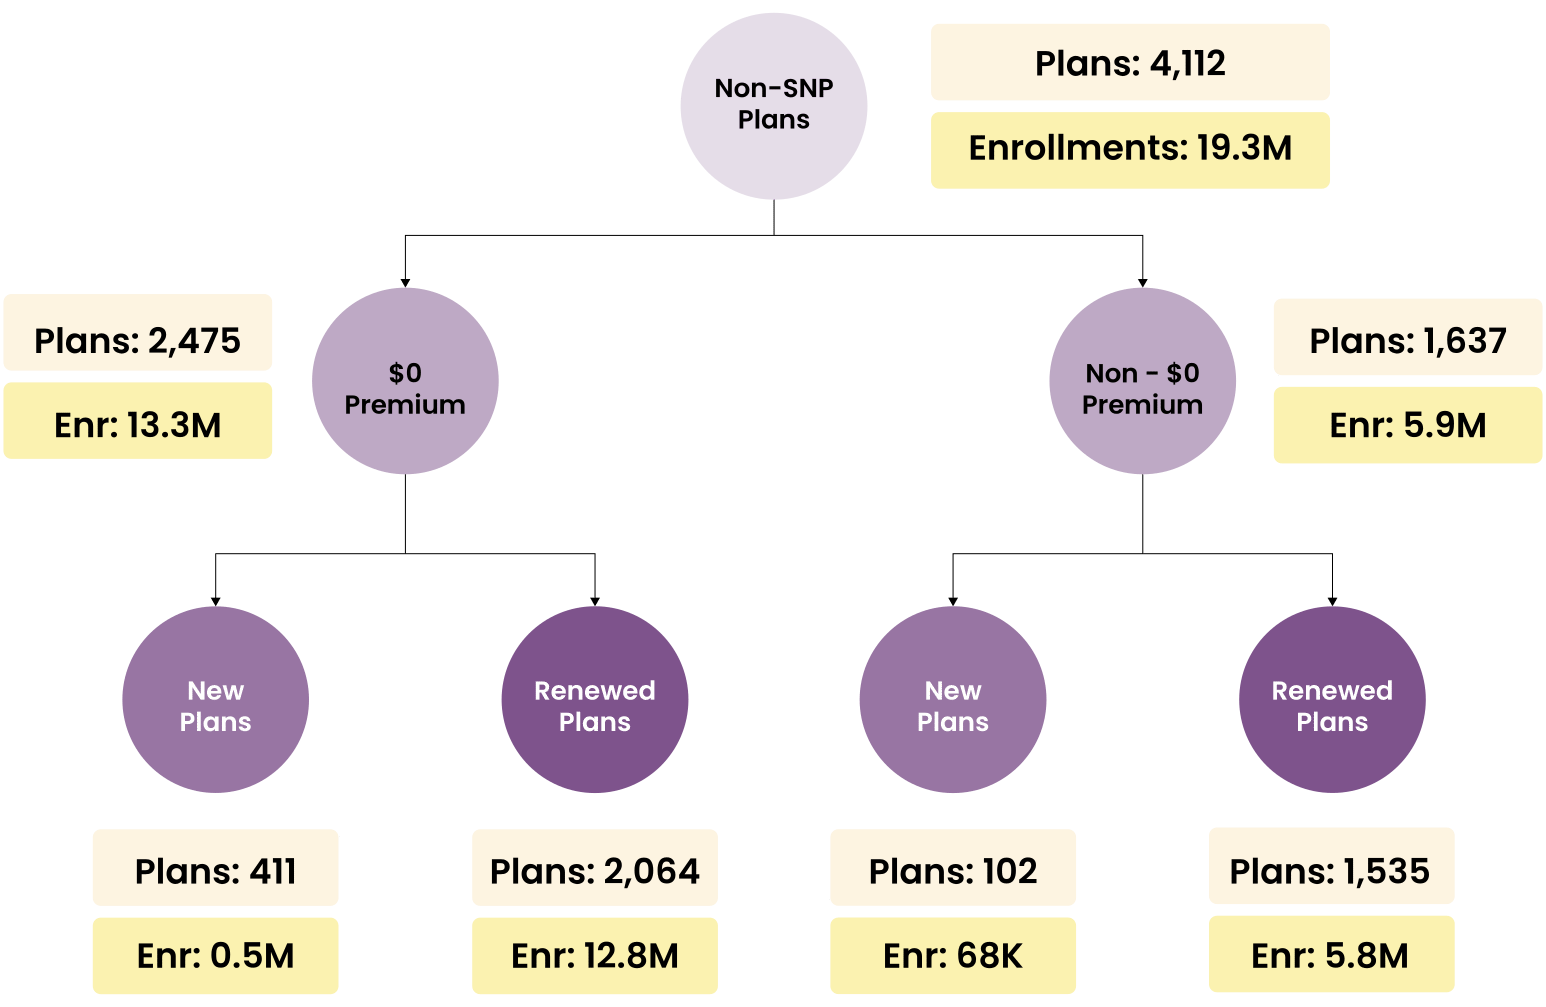
In the 2022 Medicare Advantage (MA) ecosystem, 4,112 Non-SNP Plans formed major proportion (82.6%) of the offerings made available to the beneficiaries. Within Non-SNP Plans, $0 Premium Plans now have more offerings and hold over 60% of the market share. In the $0 Premium category, new plans hold 0.53M enrollments which is a little over 7 times that of enrollments in new plans under Non-$0 Premium category.
Moreover, $0 Premium category saw 411 new plans being launched in 2022 compared to only 102 new plans in Non-$0 Premium category. Renewed plans in $0 Premium category also hold close to 7M more enrollments than in Non-$0 Premium category.
Market Overview
In 2022, $0 Premium Plans are more widely offered in the US as compared to Non-$0 Premium Plans and have captured majority enrollments across the US as a whole, including the 3 largest MA Markets of Florida, California and Texas.
There are notable state level variations in premium preferences as evident from the interactive heatmaps below. Furthermore, within states there exists significant variations in plan offerings and their respective market share. An example being California where the northern counties are more inclined towards Non-$0 Premium Plans compared to rest of the state.
Plan Cost Structure
We can see a stark difference among states based on Plan Premium. Most larger markets are tending towards lower premium values, such as Florida, which has one of the lowest Weighted Average Premium across the mainland US ($2.9). Weighted Average (Wtd Avg), computed using plan level enrollments, was selected to truly describe beneficiary preferences.
Weighted Averages of Annual Drug Deductible, OOPC and MOOP are consistently low for $0 Premium Plans across major markets such as Florida, California and Texas. New York shows a reversal of the above trend where Non-$0 Premium Plans have a generally lower cost structure. At a National level, Weighted Average Star Rating for both $0 Premium and Non-$0 Premium Plans remain at par.
Year-over-Year (YoY) Plan Segmentation
At a National level, enrollment market share is roughly divided in the ratio of 1:2 between $0 Premium and Non-$0 Premium Plans. The YoY trend signifies the fact that popularity of $0 Premium Plans has been on a dramatic increase over the last 5 years (82%) whereas Non-$0 Premium Plans has fallen by 13% in the same time. $0 Premium Plans saw a gain of 1.4M enrollments during 2021-2022 period.
Among HMO and PPO categories, there is a clear pull towards $0 Premium Plans with the number of plan offerings increasing the most in PPO followed by HMO. In 2022, $0 Premium Plans have gathered the highest enrollment growth in both HMO and PPO categories at 16% and 32% respectively. Moreover, as of February 2022, $0 Premium HMO Plans hold the highest [(enrollees)/plan] ratio at 5,347 followed by $0 Premium PPO Plans at 4,976.
Year-over-Year (YoY) Plan Type and Cost Structure
In addition to the overall shift towards $0 Premium Plans, preference in other key benefit design & cost metrics have also seen consistent change. At a National level, there is a trend among payors to offer more MAPD (Medicare Advantage Prescription Drug) plans compared to MA (Medicare Advantage) only plans. Over the last 5 years, MAPD plans have risen by 62% and the gap between number of MA and MAPD plans has grown continuously. Among the MAPD plans, those offering Zero Drug Deductible now have a lead over Non-zero Drug Deductible options with 214 more options in 2021.
While 2021 saw a 24% decrease in the number of plans with a star rating of 4.5 and above, 2022 witnessed an increase of 136% in top rated plans. While it is not possible to make a direct corellation of this increase with the ongoing pandemic using the CMS provided data, it’s fair to say that Covid-19 did have an impact. The number of plans rated 4.5/5 have increased to 1692 plans in 2022 compared to 717 plans in 2021 followed by an increase of 115% in enrollments during 2021 – 2022.
Regional variations, such as in Texas where the Non-Zero Drug Deductible Plan offerings are more than that of Zero Drug Deductible Plans, are also recognized. Weighted Average MOOP (INN) is also considerably lower for $0 Premium Plans across states such as Texas and California but is higher than that of Non-$0 Premium Plans in states such as New York, Ohio and Massachusetts.
Considerations
- This study has been carried out using Landscape data and February Enrollment file for last 5 years released by CMS
- Plans in both $0 Premium and Non $0 Premium segments with zero enrollments and are excluded in this analysis
- Net (Change) Enrollments has been calculated for the period December 2021 to February 2022
- Plans with blank Star Rating and MOOP (INN) value, implying no coverage/presence, are excluded from the calculation of weighted averages
- MA Plans with blank Drug Deductible are excluded from weighted average calculation and MAPD plans with blank Drug Deductible are considered as $0
- Weighted Average is calculated using plan level enrollments where higher enrollments imply more weightage to the plan features