Strategic & Competitive Decision Support with the HealthWorksAI True Plan Value (TPV)
May 1, 2020 Whitepaper
Introduction
The Medicare Advantage (MA) program, which allows the Medicare eligible population to choose a private insurance plan to replace or supplement Original Medicare, provides services covered by original Medicare as well as additional supplemental benefits at a direct cost to the beneficiary. The program was developed to provide beneficiaries with more options, increase the quality of care, and control costs of the Medicare program. A main competitive attribute of Medicare Advantage plans are the supplemental benefits offered and the cost to the member. Today, with approximately 24 million people enrolled in an MA plan, and a growing number of private insurers offering MA coverage, it has become critical that these plans offer richer benefits at a lower cost and reduced premiums to Medicare beneficiaries. The result has been an increasingly competitive marketplace which in turn urges the plan designers to understand market requirements and find an objective view of their plans in comparison to others. Innovation and creative differentiation has reached a critical level.
What is the HealthWorksAI True Plan Value?
Medicare Advantage payors need to evaluate their plans among the competing plans, but with numerous parameters such as benefit design, cost shares, supplemental benefits, plan costs, and the member value all playing a critical role, it’s difficult to truly provide comparison. Given the plan attributes are numerous, and not always in comparable form, the need for a quantitative estimate of the plan’s true value provided to members is therefore needed and overdue.
In the following example you’ll notice that the plans shown have varying benefit and cost structures. In standard table form one cannot analyze which plan is better or will perform well in comparison to other:
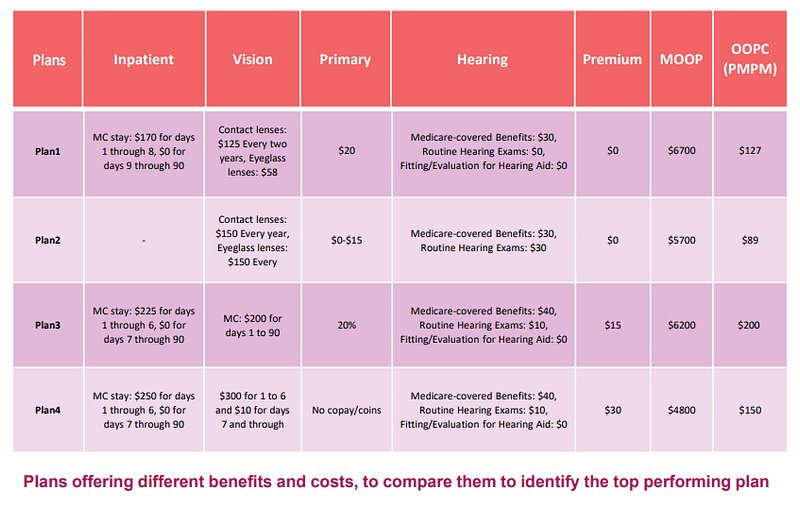
The HealthWorksAI True Plan Value (TPV), the value realized by the member, includes the cost of offering non-Medicare covered benefits, such as vision, dental, fitness, OTC. It also covers the cost of the buy down of member cost sharing that would have accrued to member under Original Medicare.
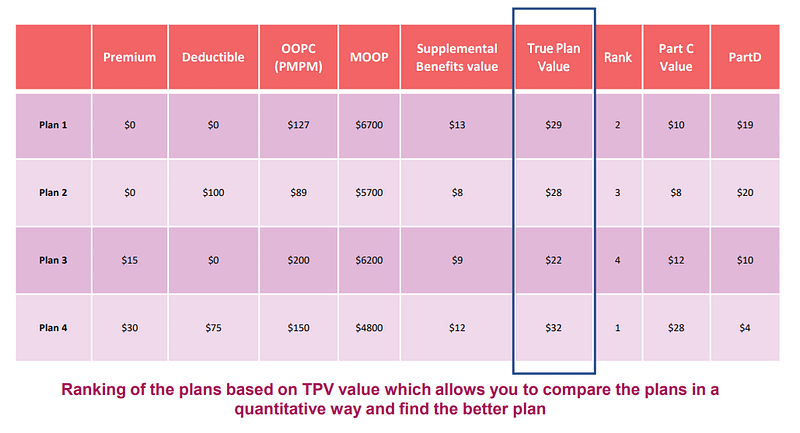
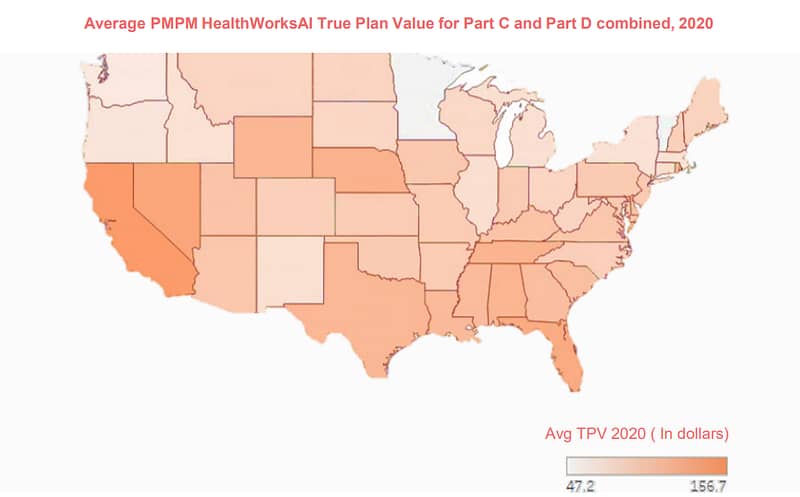
TPV scores provide a consistent score across all Medicare Advantage plans and comparison can be made at the market level and over a period of time. The results are expressed in dollars value, per member per month (PMPM), for both Part C and Part D along with the supplemental value add. The total score is the combination of Part C and Part D metrics where the higher the TPV, the more competitive and attractive the plan is in the marketplace. The TPV is provided through a comprehensive report which includes all Individual MA and MAPD plans offered in every US county for the current year as illustrated below:
How can this be used and by whom?
With CMS redefining the product landscape through legislative and regulatory policy changes focused more on member value, product and actuary teams must understand the true impact of plan cost share and benefit design for both Medicare covered and supplemental benefits on the value to members. TPV provides a reliable metric to support strategic decision evaluation, especially when combined with historical plan performance analytics.
Note:
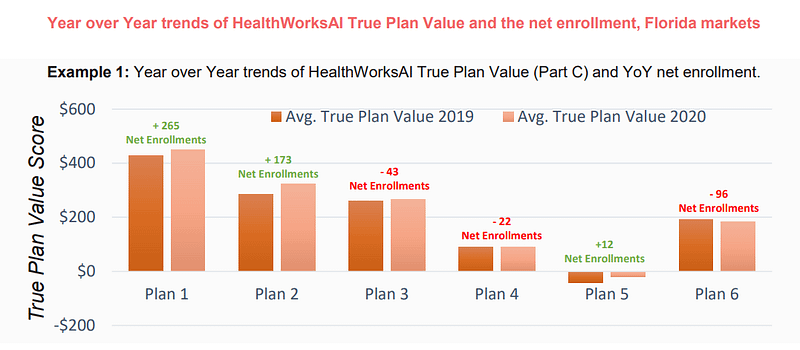
- Plan 1 gained the highest memberships in the Florida market for 2020. It also has high TPV indicating a richer plan with added value to members.
- Plan 6 observed the highest drop in TPV YoY and had the highest decrease in enrollments as well.
- Plan 3 and Plan 4 seemed to have a consistent TPV scores YoY yet failed to keep pace with the increase shown by other plans in the market.
- Plan 5 had a negative TPV each year but improved in year 2, correlating to a boost to enrollment.
Note:
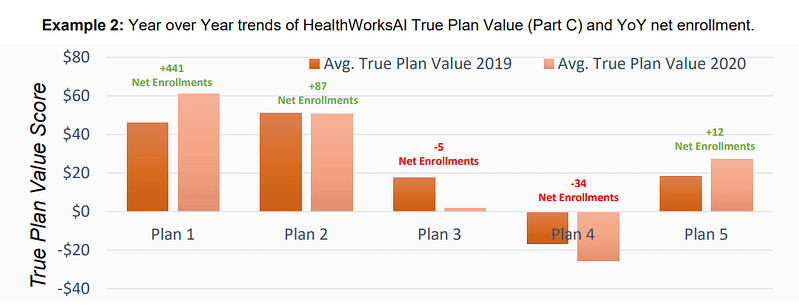
- Plan 1 gained the highest memberships in the Florida market for 2020 along with the highest increase in TPV.
- Plans 3 & 4 experienced a drop in TPV YoY and had a decrease in enrollments as well. While Plan 3 still has a positive TPV, Plan 4 continued decreasing their negative score and performed the lowest.
- Plan 2 seemed to have a consistent TPV YoY with a small gain in net enrollments.
Methodology
TPV metrics are provided in a comprehensive report which includes every individual MA/ MAPD plan offered. Values are available at the state and county level, allowing for the analysis at the individual geographical region. The TPV leverages basic identifiers, such as plan id, plan type, parent company, state, county as well as CMS Plan Benefit Package (PBP) data on premiums, benefit costsharing, supplemental benefit coverage offered, enrollments for plans, Part B giveback amount, formulary information, etc.
Part C
TPV to member is a function of Original Medicare cost share buydown, cost of non-Medicare covered benefits also known as supplemental benefits and the member premium (part C only). Each component in the calculation involves a degree of data gathering and statistical modeling from various nationwide datasets. To assess the Original Medicare cost share buy down, we leverage feefor-service (FFS) costs at the county level and the respective cost for each MA/MAPD plan. The Values are then adjusted, using each plan’s risk scores, to reflect the morbidity and the geographical
factor. Additionally, using the CMS PBP files, we then derive the value of the non-Medicare covered benefits such as Dental, Vision, Hearing, etc. that are offered by plans using our proprietary benefit specific pricing models. Our models have been developed and validated by multiple industry actuaries with extensive experience in benefit pricing.
Part D
In determining the Part D plan value to the member, benefit structure and formulary play the biggest part. The benefit structure includes the Initial Coverage Limit (ICL), tier level cost information and the other supplemental benefits while the formulary provides information on the drugs covered and excluded, determining formulary richness. Richer formularies are an indication of higher value to the member.
Conclusion
In conclusion, the evaluation of a plan’s value to the member is an objective score which allows you measure a plan’s competitiveness in the market and includes multiple variables such as cost share, service offerings in the form of supplemental benefits, and drug benefits. Geographical factors and history of each plan are considered any necessary adjustments to reflect more accurate values are made, providing a more meaningful assessment.