
NetworkIntel™

See Every Competitor’s Network Move Before They Make It.

Give your network, growth, and strategy teams full visibility into your network and every competitor — down to the NPI level.

  • See exactly which providers give competitors their edge — at the hospital, group, TIN, and NPI level
  • Map PCP-to-group affiliations across your market — see how primary care is organized and which groups anchor competitor networks
  • Detect competitor network buildout months before their service area expansion filings
  • Generate keep/add/drop NPI contracting lists in minutes, not weeks of analyst work
  • Identify vulnerable counties, contracting gaps, and strategic growth opportunities earlier.

3,300+ Counties

Competitive network position scored nationwide

NPI-Level Scoring

Provider-level benchmarking across every competing plan

4 Network Pillars

Adequacy, competitive intelligence, provider intelligence, and enrollment impact

$2M+ Saved

By one plan identifying outlier hospitals in just two counties

The Reality

Why Network Strategy Still Runs on Incomplete Data

  • Plans spend millions designing networks without knowing whether their network is stronger or weaker than competitors in any given county

  • Rivals are quietly building network footprint in markets you operate in — and you can’t see it until they announce it.
  • Contracting lists are built around adequacy constraints, not intelligence about which specific providers drive competitive advantage

  • Ghost providers are creating adequacy risk that stays invisible until a CMS audit finds it

"NetworkIntel integrates multiple provider data sources into a single, usable view—so we can evaluate our network and competitors side by side. The platform delivers actionable insights that improve key performance metrics, and the Medicaid-specific insights have been invaluable."

Medicare Network Performance Executive

National Payer


View Case Studies → 

The Intelligence

From Strategy to Contracting Action — In One Platform

NetworkIntel is structured as a layered analytical workflow — not a disconnected list of features.
Every step moves from broad strategic picture to individual contracting action.
Beyond Adequacy Standards

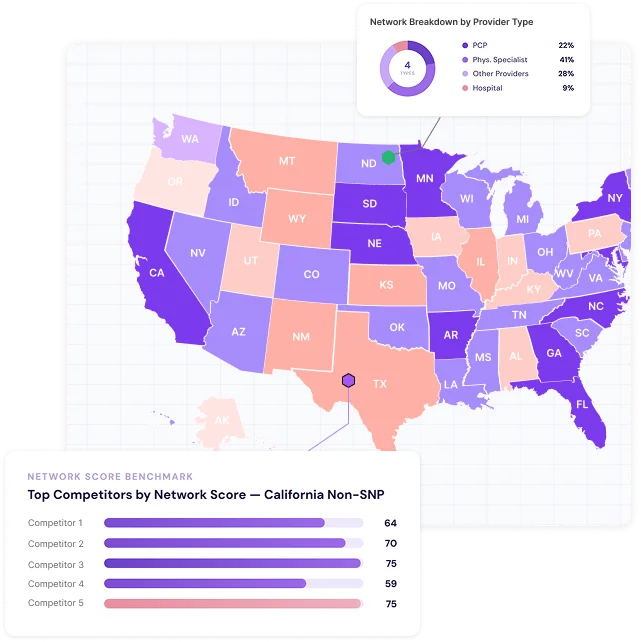
  • Single composite network score per plan per county — combining breadth, depth, specialty mix, utilization, and quality

  • See competitors side-by-side on a heat map. Understand whether a rival runs a narrow high-quality network or a broad lower-performing one


  • 350+ configurable specialties, weighted to match what matters most in your specific markets

Provider Directory vs. Actual Access

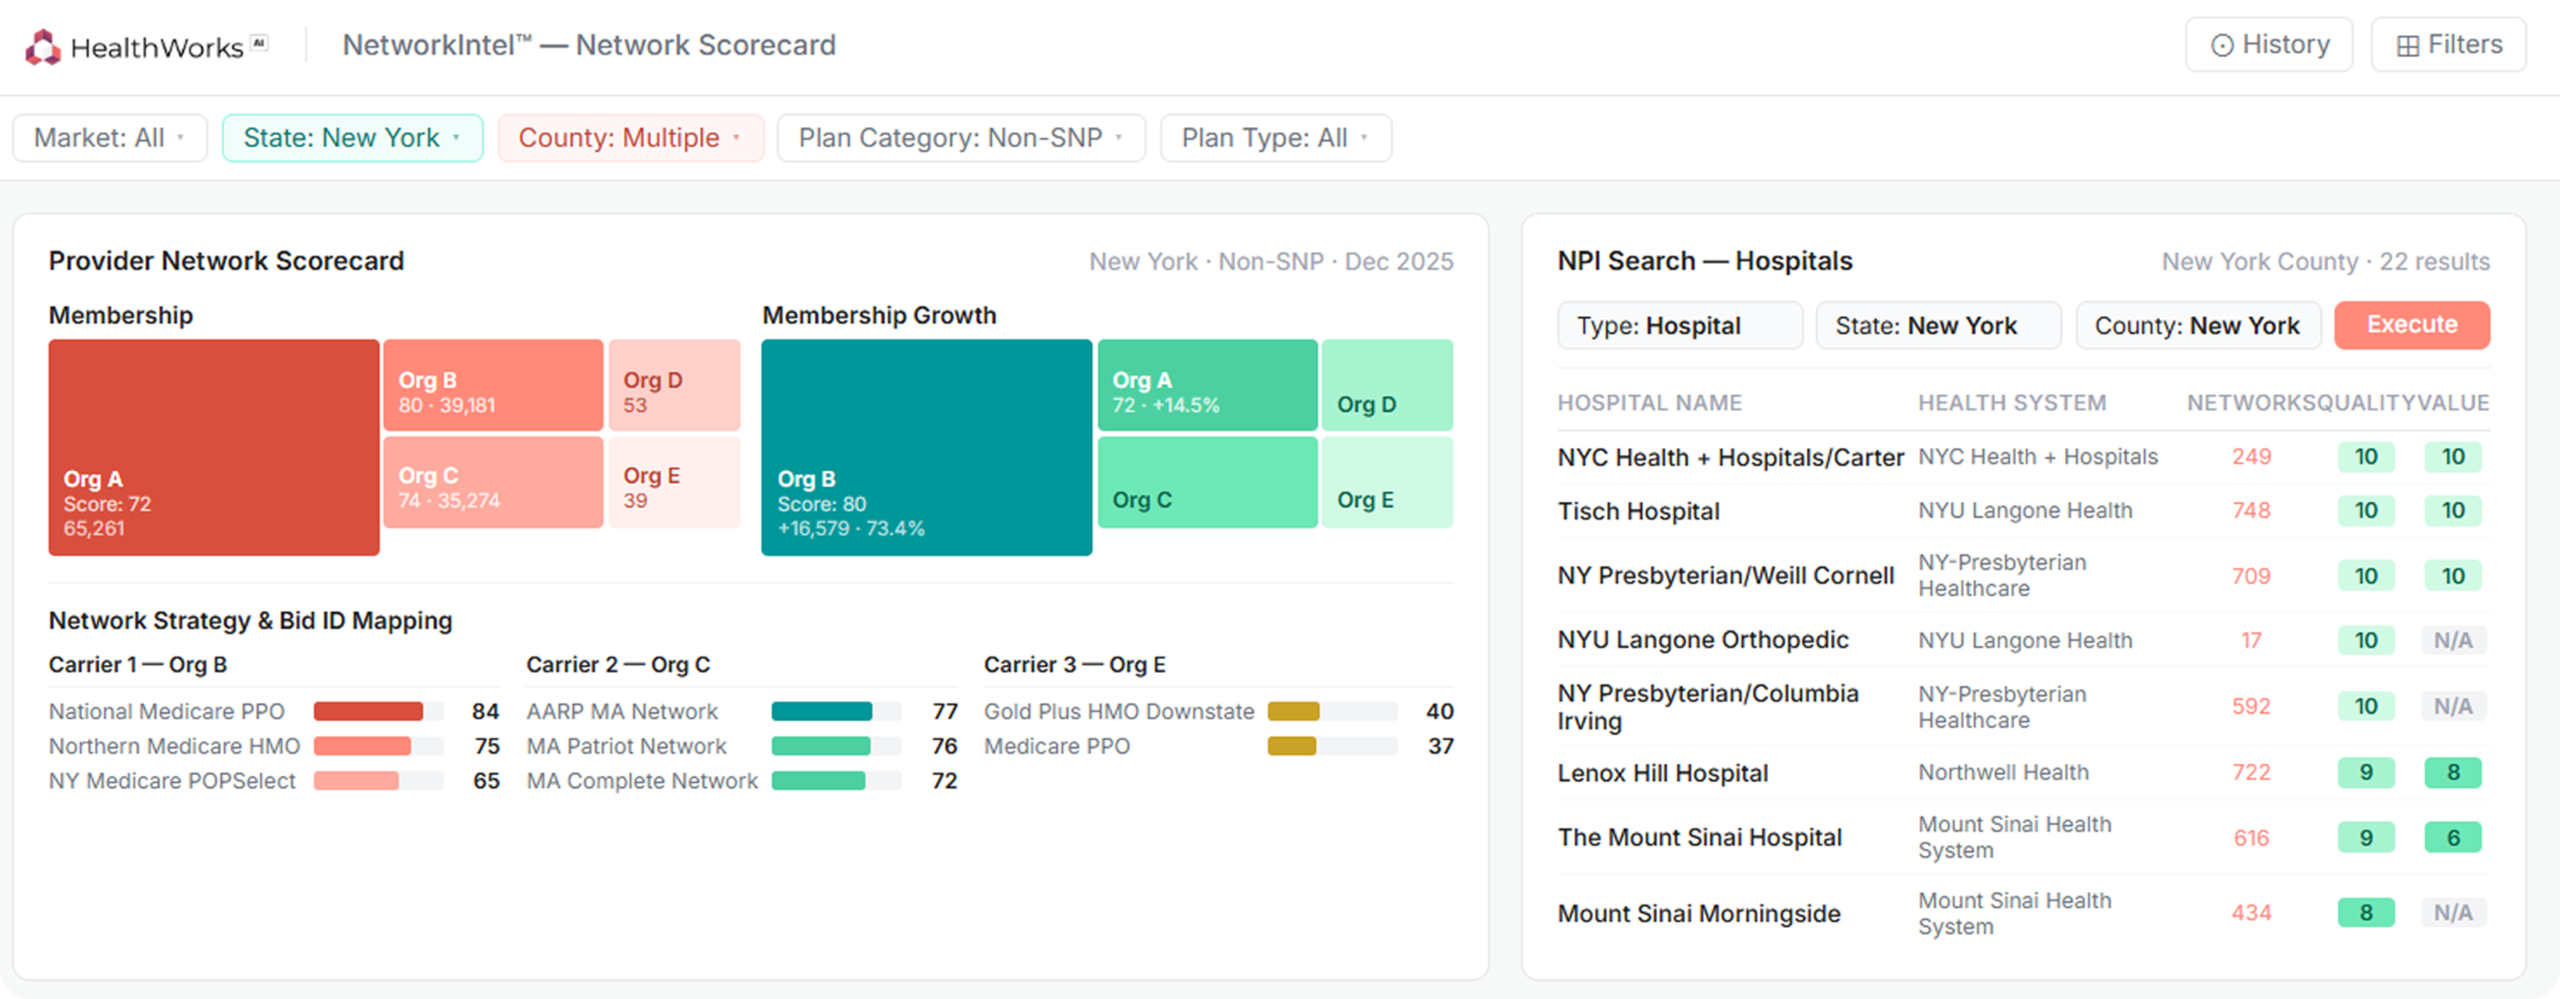
  • Search and filter individual providers by specialty, geography, group affiliation, and quality score

  • HealthWorksAI’s proprietary NPI Score measures how attractive a provider makes your network for health plan members — not a cost metric, a competitive appeal metric

  • Location confidence scores flag ghost providers before they become a compliance problem

Physician Group Affiliation

  • See where competitors are expanding network density before filings become public.
  • Identify alternative groups if a target is unattainable. Understand exactly what it costs your network if a key group leaves your network.

Shared Providers, Unique Gaps

  • NPI-level breakdown of your network vs. any competitor — common providers, providers unique to you, providers unique to them.


  • Identify exactly which providers differentiate winning networks and where the quality gaps are.

How Teams Use NetworkIntel™

From strategic planning to daily contracting decisions, NetworkIntel fits the way
your teams actually work — and when the stakes are highest.

Chief Strategy & Growth Officers

Peak window: January–June (bid season)

  • Before approaching any group, see how many NPIs are in it, their specialties, their quality scores, and which hospitals they’re affiliated with.
  • Identify alternative groups if a target is unattainable. Understand exactly what it costs your network if a key group leaves your network.

VP Network & Market Expansion

Peak window: January–August (SAE filings and contracting)

  • NetworkIntel shows provider penetration rates in every target county before you file — so you know which counties to enter.
  • Track network adequacy continuously across all markets so the triennial CMS check confirms your position rather than exposing it.

Network Analysts & Contracting Teams

Peak window: January–June (hospital renegotiations)

  • Run NPI-to-NPI and group-to-group comparisons against any competitor.

  • Generate keep/add/drop lists with quality and utilization scoring.

  • As hospital contract renewals approach, use group-level comparisons to understand leverage — who else has them, what they’re worth, and what walking away actually costs.

Quality & Compliance Teams

Peak window: August–September (AEP preparation and CMS checks)

  • Monitor adequacy status across all counties and specialties in real time.

  • Identify ghost providers before triennial CMS checks find them.

  • In the months before AEP, use network quality scores to identify the markets where network strength is a genuine brand differentiator worth leading with.

Ready to Design
Your Competitive Advantage?