The impact
Decisions backed by data, delivered in a fraction of the time.
Anticipated overspend
Estimated benefit dollars redirected away from richness that wasn't moving enrollment, to be confirmed against actual AEP enrollment.
Bid modeling turnaround
What used to take weeks of manual modeling now takes minutes, not days.
To an executive-ready answer
Natural language queries turn a competitor benefit question into a sourced, presentation-ready insight.
*Indicative figure, anticipated pending confirmation against actual AEP enrollment.
Portfolio-wide coverage
184 bid × simulation combinations across 20 unique bids, nearly 60% of the portfolio, SNP and Non-SNP alike.
Faster answers
What used to take weeks of manual modeling now takes minutes, keeping pace with a bid calendar that doesn't wait.
Evidence, not opinion
Every scenario logged and reproducible, built to be defended in front of actuaries and leadership.
HealthWorksAI’s Benefit Simulator helped us narrow in on the flex card value. Until we reached a certain level, we would not see a change in enrollment, and not every dollar of investment returns the same lift. That insight shaped the argument we needed to make.
The challenge
A benefit budget, and hard questions about where every dollar should go.
As an integrated, provider-sponsored plan, the health plan competes on care quality, which makes every benefit dollar a deliberate trade-off. That trade-off had to hold up across a 35-PBP portfolio, not just a single plan.
Where should the next dollar go?
Not every dollar of richness moves enrollment the same amount. Knowing the cutoff before bid lock changes the conversation with actuaries.
Where do members go when a plan closes?
Market exits ripple through nearby plans. Without disruption modeling, that shift shows up as a surprise instead of a forecast the team saw coming.
How do we make the case with actuaries?
A defensible number beats a strong opinion. Simulated scenarios turn a benefit decision into evidence.
How do we move faster than the manual grind?
Manual bid modeling eats weeks per cycle. An executive-ready answer in minutes changes what's possible before filing.
What they did with the Benefit Simulator
From guesswork to a response curve they could act on, across the bid.
HealthWorksAI's Benefit Simulator ran 184 bid x simulation combinations across 20 unique bids, covering both SNP and Non-SNP plans, nearly 60% of the full portfolio. Section D supplemental benefits, flex card, annual drug deductible, dental, and MOOP were all war-gamed to find where each benefit dollar stops earning enrollment.
This is the pattern HealthWorksAI's Benefit Simulator surfaces for every benefit lever it tests: more investment moves enrollment only up to a point. The curve above is the flex card, one of five levers war-gamed on this bid, chosen here simply because it's the easiest to walk a room through.
Tested changes against the full market basket
The simulator accounted for how one benefit change shifts the value of others and how the plan sits against the competitive market, not in isolation.
Positioned plans with True Plan Value
True Plan Value views showed each plan against competitors: in the mix, richer than the market, or leaner than it. Views could be saved for executive and actuarial discussion.
See where your own benefit dollars would earn the most enrollment.
Bring your full portfolio to the Benefit Simulator and model the trade-offs before you file. Our team will walk you through it.
Request a Benefit Simulator WalkthroughThe HealthWorksAI Platform
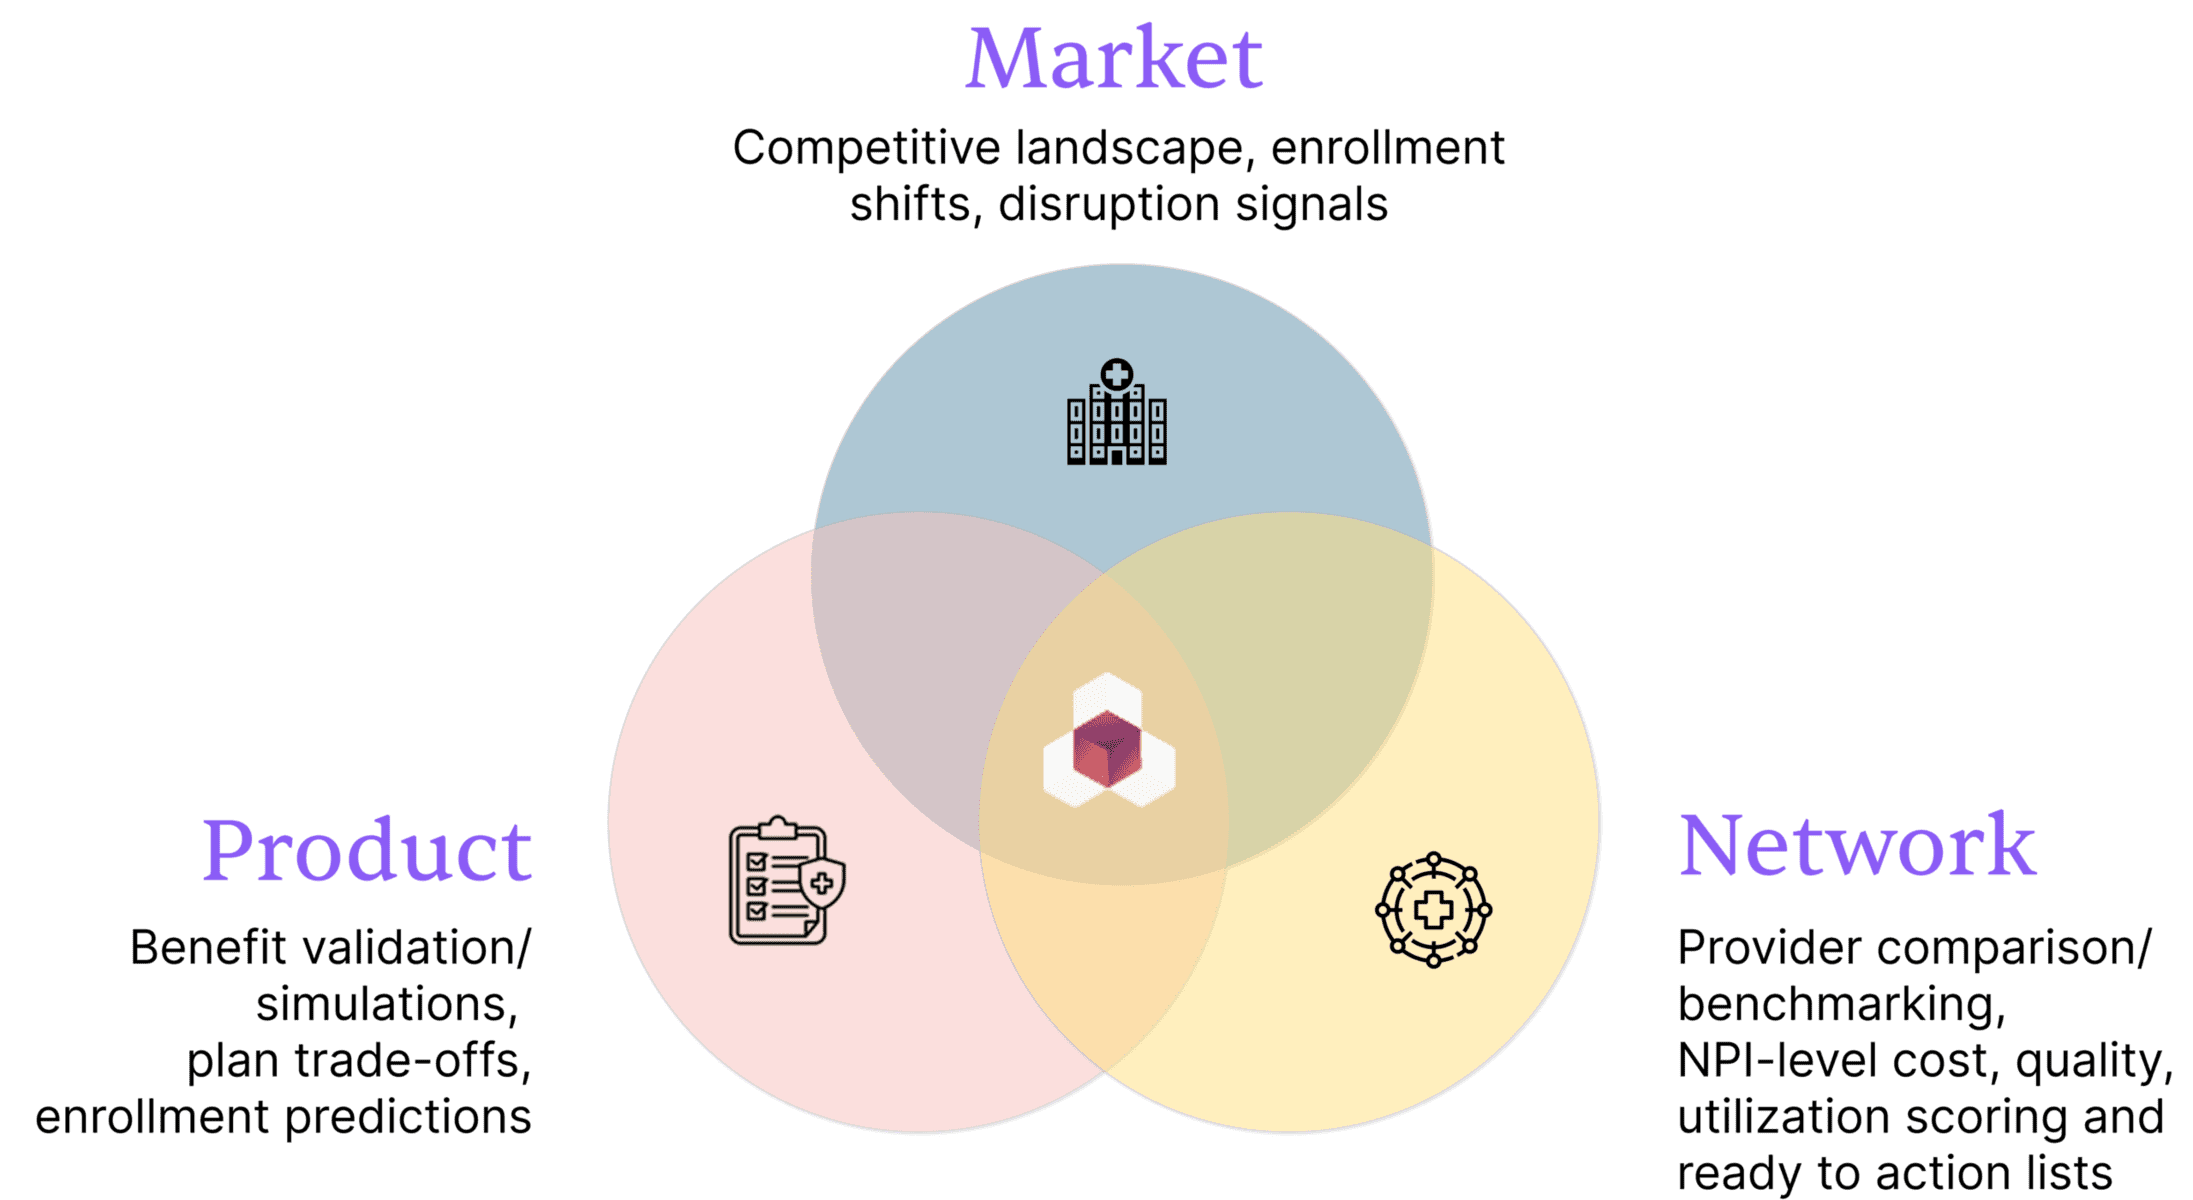
Where market, product, and network insights intersect
One data layer behind the market, product, and network intelligence used throughout this case study.