Elevance Health Q3 2026 Earnings Insight: Critical Takeaways
This report is a HealthWorksAI breakdown of Elevance Health's Q3 2026 earnings call and its 2027 Medicare Advantage plan footprint, with a scorecard against its Q2 2026 commitments, key leadership commentary, guidance, and what it means for competing health plans.
Section 1
Executive summary: Elevance Health Q3 2026 earnings takeaways
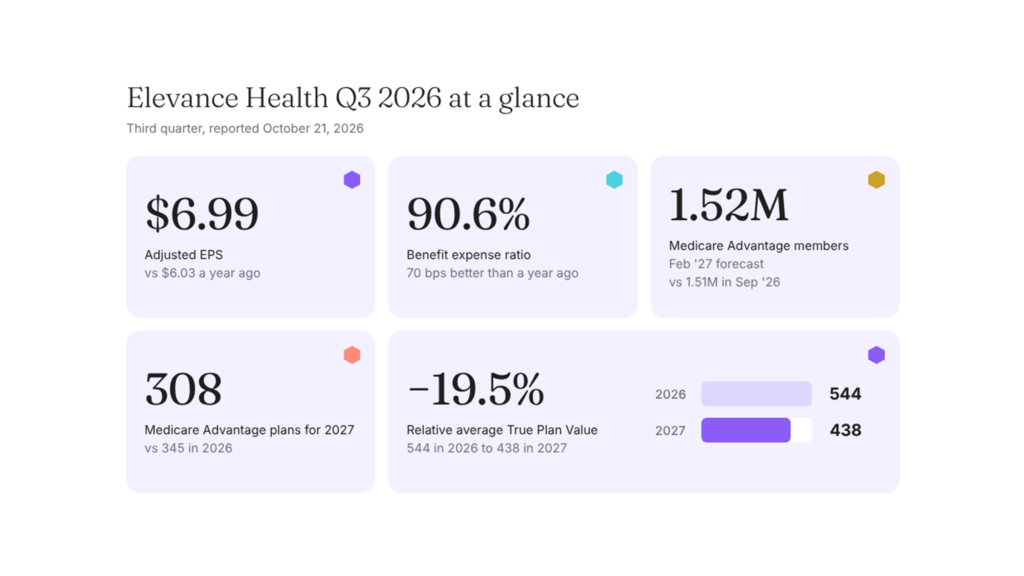
Elevance Health Q3 2026 earnings are a clear beat with a quality caveat. Adjusted EPS was $6.99 against $6.03 a year earlier and $4.70 expected by analysts, revenue was $50.4 billion, and the full-year adjusted EPS outlook was raised to at least $29. The benefit expense ratio improved 70 basis points to 90.6%, although the quarter included a net $1.85 per share of non-operating benefit, mostly investment-income valuation adjustments, against about $0.50 per share of operating outperformance, so the headline overstates what is likely to repeat.
The 2027 Medicare Advantage data points to a deliberate pullback: 308 plans against 345, a net loss of four counties (26 entered, 30 exited), and Florida plans cut almost in half, from 103 to 52. Seventy-three plans keep a $0 drug deductible, while plans in the top deductible tier fall from 95 to 33. HealthWorksAI's relative True Plan Value for Elevance falls 19.5% for 2027, and our forecast has its Medicare Advantage enrollment roughly flat, up 0.7% to 1.52 million by February 2027.
1. Earnings
Adjusted EPS, third quarter
Outlook raised to at least $29, from at least $27.00 after Q2. Revenue $50.4B, ahead of the $49.3B expected.
2. Benefit expense ratio
Share of premiums paid out as medical costs
70 basis points better than a year ago, while the adjusted operating expense ratio rose 90 basis points to 11.3%. Axis 90% to 92%, lower is better.
3. Medicare Advantage members
Millions, HealthWorksAI enrollment data and forecast
+10,302 members, or +0.7%. A forecast of a flat book on a smaller footprint.
4. The 2027 plan map
Elevance Medicare Advantage plans in its three largest states, 2026 to 2027
20262027
308 plans against 345, net −4 counties, and 46.8% of plans are special needs plans. Scale 0 to 120 plans.
5. True Plan Value
HealthWorksAI's proprietary measure of benefit value. Relative average across Elevance plans
−19.5%
Elevance's relative average True Plan Value falls 106 points across its 308 plans for 2027, and is down 38.5% from 2024.
Section 2
Key leadership commentary
The commentary below summarizes statements on Elevance Health's Q3 2026 earnings call transcript, with one short verbatim phrase. The interpretations are ours.
On the quarter
Medicaid, Medicare Advantage and individual ACA each contributed to results that came in ahead of the company's own outlook, and management presented that as the basis for a higher 2026 earnings baseline.
Gail Boudreaux, President and Chief Executive Officer, Elevance Health
What this really means: the broad attribution is helpful, but the CFO also described a net $1.85 per share of non-operating benefit against about $0.50 of operating outperformance, so the operating figure is the cleaner read.
On Medicaid
“…2026 as the trough for our Medicaid margin…”
Mark Kaye, Chief Financial Officer, Elevance Health
What this really means: July 1 rate updates lifted the second half, but the CFO said rates have not fully caught up with cost trend, which remains elevated though stable. Medicaid is where the 2027 growth math is most exposed.
On the growth outlook
From a raised baseline of at least $26.75, management still expects adjusted EPS growth of at least 12% in 2027, driven by better health benefits margins, wider adoption of Carelon's solutions and operating efficiency, and said it does not rely on any single business.
Gail Boudreaux, President and Chief Executive Officer, and Mark Kaye, Chief Financial Officer
What this really means: 12% off $26.75 works out to roughly $30 per share for 2027 (HealthWorksAI arithmetic). A formal 2027 outlook is expected with the January earnings call.
More from the call
On Medicare Advantage margin
Medicare Advantage is on course for a 2026 operating margin of at least 2%, with improvement expected in 2027 toward a long-term range of 3% to 5%.
Felicia Norwood, Chief Health Benefits Officer
On Star Ratings
About half of Medicare Advantage members will be in plans rated four stars or higher for 2027, and the enterprise average is again four stars.
Gail Boudreaux, President and CEO
On the 2027 enrollment period
The selling approach emphasizes HMO plans and dual-eligible members, with plan designs that protect the benefits members value most under a measured view of cost trend.
Gail Boudreaux, President and CEO
On integrated pharmacy
Members in integrated medical and pharmacy plans save up to $100 per month and have about 30% fewer emergency room visits.
Mark Kaye, CFO
On individual ACA
Membership ended the quarter near 1.3 million and is expected to finish the year at 1.2 million or more, and the risk pool may take more than one renewal cycle to settle.
Gail Boudreaux, President and CEO, and Mark Kaye, CFO
On capital
Near-term capital posture is intentionally disciplined, with targeted investment first and share repurchases kept opportunistic.
Mark Kaye, CFO
Section 3
Did they deliver on what we flagged last quarter?
Measured against HealthWorksAI's own Elevance Q2 2026 Earnings Insight, covering the company's July 15, 2026 earnings call, which flagged five commitments and watch items worth tracking into Q3.
| What we flagged after Q2 2026 | What actually happened in Q3 2026 | Verdict |
|---|---|---|
| Q3 adjusted EPS landing near 17% of the full-year guidance of at least $27.00, about $4.60. | Adjusted EPS was $6.99, well above that marker, though it included a net $1.85 per share of non-operating benefit. Full-year guidance raised to at least $29. | Delivered |
| At least 12% adjusted EPS growth in 2027, off a 2026 baseline of at least $26. | Baseline raised by $0.75 to at least $26.75, and the 12% growth goal for 2027 reaffirmed from the higher base. | Delivered |
| Medicaid margin inflecting toward the trough thesis, with full-year margin guided near −1.75%. | Q3 Medicaid came in ahead of outlook on rate actions, and the full-year margin is now slightly ahead of prior guidance. 2026 is still called the trough and cost trend is still elevated, though stable. | On track |
| The accelerated second-half spend showing results, rather than just a higher expense ratio already guided to the upper half of its range. | The adjusted operating expense ratio rose 90 basis points to 11.3% on one-time investments, while the benefit expense ratio improved 70 basis points. Any payoff for 2027 is still to be proven. | Mixed |
| More Medicaid market exits beyond D.C. over 12 to 18 months, and Medicare Advantage membership decline staying within plan. | No further Medicaid exits were announced on the Q3 call. Medicare Advantage margin is on course for at least 2%, and our data shows 37 fewer plans for 2027 with enrollment forecast roughly flat. | Partial |
This scorecard shows two of five items delivered cleanly and one on track. The payoff from the second-half spend and the Medicaid exit path are the open cases: real progress on paper, with the cleaner test still ahead.
Section 4
What's actually changing
The benefit expense ratio improved, and non-operating items drove most of the upside
The ratio of 90.6% is 70 basis points better than Q3 2025, with Medicaid, Medicare Advantage and individual ACA each ahead of outlook. Management put about $0.50 per share down to operating outperformance and a net $1.85 per share to non-operating items, mainly investment-income valuation adjustments, partly offset by state tax items. In Q2 the equivalent below-the-line item was $0.80 per share, which management redeployed into second-half spending. The adjusted operating expense ratio rose 90 basis points to 11.3% as the company made one-time investments in member experience, medical cost management, Carelon and Stars.
Benefit expense ratio
Share of premiums paid out as medical costs
Axis runs 90% to 92%. Lower is better. Year-ago ratio derived from the reported 70 basis point improvement.
Adjusted EPS by quarter
$ per share
Where the Q3 upside came from
$ per share, as described by the CFO
$0.50 operating outperformance against a net $1.85 non-operating benefit, mainly investment-income valuation adjustments.
Medicare Advantage: the 2026 pullback is working, and 2027 continues it
Management said product and geographic actions taken for 2026, and the quality of the membership it kept, support a full-year margin of at least 2%. The 2027 plan is built to move that higher toward a 3% to 5% long-term range, with an emphasis on HMO plans and dual-eligible members.
Medicare Advantage margin
2026 operating margin against the long-term range
The band is the 3% to 5% long-term target. Scale 0% to 6%. Management expects 2027 to improve on 2026.
Quality
Share of Medicare Advantage members, 2027 Star Ratings
Bar scale for the rating is 0 to 5 stars. Management called Stars a multi-year priority and is investing in member experience, clinical quality and provider engagement.
The 2027 map is smaller overall, and Florida is cut in half
Elevance goes from 345 plans to 308, a cut of 37 that compares with a net decline of 34 plans across all payers, and from 1,594 counties to 1,590 (26 entered, 30 exited). Florida plans fall from 103 to 52 and California from 44 to 38, while Texas rises from 25 to 33. Special needs plans are 144 of 308, or 46.8%. On drug deductibles, 73 plans carry $0, and plans in the top deductible tier fall from 95 to 33 as that tier moves from $615 to $700. Counts come from HealthWorksAI's analysis of the CMS 2027 plan benefit and crosswalk files.
Plans in the three largest states
Elevance Medicare Advantage plans, 2026 to 2027
20262027
Florida 103 to 52, California 44 to 38, Texas 25 to 33. Together these three states hold 123 of Elevance's 308 plans. Scale 0 to 120 plans.
Total plans
Elevance Medicare Advantage plans, 2026 to 2027
−37 plans, or −10.7%.
Counties entered and exited
1,594 counties in 2026 to 1,590 in 2027, a net loss of 4
A county counts as exited only when Elevance has no plan left in it.
Special needs plans, share of 2027 plans
Elevance 144 of 308 plans, against 35% for all payers
Elevance, 46.8%
All payers, 35%
Plans with a $0 drug deductible
Elevance 73 of 308 plans in 2027, against 450 of 5,558 for all payers
Elevance, 23.7%
All payers, 8.1%
Elevance holds 5.5% of all plans but 16.2% of the plans that keep a $0 drug deductible.
Top drug deductible tier, Elevance plans
The tier moved from $615 in 2026 to $700 in 2027
−65.3%, from 27.5% of plans to 10.7%. A lower count in a higher tier says little about member costs on its own.
True Plan Value has fallen every year, and fastest for 2027
True Plan Value (TPV) is HealthWorksAI's proprietary measure of the value of plan benefits members realize above and beyond traditional Medicare, across Part C, Part D and Part B giveback. Elevance's relative average falls from 711.7 in 2024 to 438 in 2027, a decline of 38.5%, with the steepest single-year drop of 19.5% for 2027.
Elevance relative average True Plan Value
Relative average across Elevance plans, 2024 to 2027
Year-over-year change in True Plan Value
Elevance relative average
Averages blend plan and county mix, so read the direction more than the decimals.
Management pointed to cost management and Carelon alongside the ratio
The call cited an oncology engagement program, a medical cost platform that has found over $300 million of anticipated savings this year, and integrated medical and pharmacy results.
Cutting avoidable cost
Reductions reported by management
The 15% reduction is from Carelon's cancer care engagement program in the commercial market. The ER figure is for members in integrated medical and pharmacy plans, who also save up to $100 per member per month.
Carelon momentum
Retention and 2027 selling season
New 2027 wins span behavioral health, clinical care services, and specialty and post-acute. Jeff Park was named President of Carelon. Bar scale is 0 to 100%.
From the HealthWorksAI desk · The 2028 bid
Every plan Elevance dropped was a bid decision. The 2028 round is already open.
37 fewer plans, Florida cut almost in half, a 46.8% special needs mix: each was a trade-off between margin and membership, settled in June's bids. With Elevance's True Plan Value down 19.5% for 2027, its steepest drop since 2024, the question for 2028 is how your members would react if you made the same cut, or held the line when others didn't. That can be modeled, benefit by benefit, before anything is filed.
How plans test a benefit change before they bid →Section 5
Where the guidance goes from here
Adjusted EPS guidance and baseline, 2026
$ per share, at least figures
The baseline is the earnings level management uses as the starting point for 2027 growth. Bar scale is $0 to $29.
Operating cash flow guidance, 2026
$ billion, at least
Q3 operating cash flow was $1.3 billion. Days in claims payable were 44.9, up 3.5 days from a year ago.
Section 6
How the competitive picture is shifting
The footprint is geographically uneven
Plans in Florida (−49.5%) and California (−13.6%) fall while Texas rises 32%, so opportunities are best read at county and product level.
Special needs products anchor the portfolio
Elevance's 144 SNP plans are 46.8% of its 308, against 35% for all payers, and management is leaning into dual-eligible members for 2027.
Drug deductibles are being rebalanced
73 of Elevance's plans keep a $0 drug deductible, 23.7% against 8.1% for all payers, while plans in the top $700 tier fall to 33 from 95 at $615 in 2026.
Quality is a lever, with room to run
About half of Medicare Advantage members are in 4+ Star plans for 2027, against the 70% industry average cited on UnitedHealthcare's Q3 call.
The market read the quality of the beat
Shares were down 1.23% in pre-market trading to $434.77 after the report, near the top of a 52-week range of $274.84 to $450.69.
Beyond Medicare Advantage: Elevance signals from the call
Medicaid margin
2026 against the long-term target
The band is the 2% to 4% long-term target. Scale −3% to 5%. 2026 is called the trough year.
Individual ACA members
Millions
Retention beat plans as members moved to lower-premium bronze plans. Fourth-quarter attrition is still expected above historical levels.
Commercial pricing
Management's stance for the 2027 selling season
2026 and 2027 were both priced for a low double-digit cost trend, with stable year-over-year margins expected. Several large employers returned to Anthem, and independent dispute resolution pressure is concentrated in self-funded business.
Section 7
What this means for your plan
If you compete in Florida, California or Texas
A lower state plan count does not by itself show a county withdrawal or how many members are displaced. Florida's drop from 103 to 52 plans is the largest, and county-level detail is the next layer to look at.
If you compete in special needs plans
Elevance has 88 D-SNP and 52 C-SNP plans and is leaning into HMO and dual-eligible members for 2027. D-SNP and C-SNP serve different members under different rules, and an all-plan average blends them.
If you benchmark medical management
The 90.6% is a consolidated benefit expense ratio across Elevance's health benefits businesses, not the Medicare Advantage book alone, and the EPS beat also included non-operating items outside the ratio.
If you look at benefit value
True Plan Value describes the value of benefits members realize. It does not measure enrollment, margin or Star Ratings, and averages blend plan and county mix.
Reading note: a county counts as exited only when Elevance has no plan left in it, so plan-level changes can be larger than county-level ones.
How HealthWorksAI helps you act on this
HealthWorksAI brings payer moves by county, benefit value by plan and network fit into one platform, so a plan team can see where a competitor's 2027 map overlaps its own markets.
Your next move
From what changed in 2027 to what your team does about it
The 2028 bid, this AEP's enrollment and next year's network plan all start from these shifts. Here is where each team picks them up.
Common questions
Elevance Health Q3 2026 earnings: common questions
What were Elevance Health's Q3 2026 results?
Elevance Health reported adjusted earnings of $6.99 per share for Q3 2026, against $6.03 a year earlier and $4.70 expected by analysts, on revenue of $50.4 billion against $49.3 billion expected. The benefit expense ratio was 90.6%, 70 basis points better than a year ago. The company raised its 2026 adjusted EPS outlook to at least $29.
Did Elevance Health raise its 2026 guidance?
Yes. Adjusted diluted EPS is now expected to be at least $29, up from at least $27.00 after Q2, and operating cash flow is expected to be at least $6.5 billion, up from at least $6.0 billion. The 2026 earnings baseline rose $0.75 to at least $26.75.
Why does the quality of Elevance's Q3 beat matter?
Management attributed about $0.50 per share to operating outperformance and a net $1.85 per share to non-operating items, mainly investment-income valuation adjustments, partly offset by state tax items. Non-operating items may not repeat, so the operating figure is the cleaner read of underlying performance.
What is Elevance's True Plan Value for 2027?
HealthWorksAI's True Plan Value, a proprietary measure of benefit value, averages 438 on a relative basis across Elevance's 308 Medicare Advantage plans for 2027, against 544.1 for 2026. That is a 19.5% decline, and the average is down 38.5% from 711.7 in 2024.
How many Medicare Advantage plans will Elevance offer in 2027?
HealthWorksAI's analysis of CMS data shows 308 Elevance Medicare Advantage plans for 2027 against 345 in 2026, in 1,590 counties against 1,594 (26 entered, 30 exited). Florida falls from 103 to 52 plans and California from 44 to 38, while Texas rises from 25 to 33. Special needs plans are 144 of the 308, or 46.8%.
How many Medicare Advantage members does Elevance have?
HealthWorksAI's enrollment data shows 1,509,671 Elevance Medicare Advantage members in September 2026, and our forecast is 1,519,973 for February 2027, an increase of 10,302 or 0.7%. Actual annual enrollment results follow in early 2027.
What are Elevance's drug deductibles for 2027?
HealthWorksAI's analysis of CMS data shows 73 of Elevance's 308 Medicare Advantage plans have a $0 drug deductible for 2027, or 23.7%, against 8.1% of plans across all payers. Plans in the top deductible tier fall from 95 at $615 in 2026 to 33 at $700 in 2027, a decline of 65.3%.
What did Elevance say about Medicare Advantage margins?
Management expects a 2026 Medicare Advantage operating margin of at least 2%, with improvement in 2027 and a long-term target range of 3% to 5%. About half of its Medicare Advantage members are in 4+ Star plans for 2027, and the enterprise average rating is four stars.
What did Elevance say about 2027?
Management expects adjusted EPS growth of at least 12% in 2027 off the raised baseline of at least $26.75, supported by health benefits margin improvement, Carelon expansion and operating efficiency. It said it will share more detail on the January earnings call, and expects Medicaid margins to improve after 2026.
Download the full report as a PDF
Enter your work email and the Elevance Health Q3 2026 Earnings Insight downloads instantly.
Thanks! Your download should start now. If it doesn't, open the PDF here.