How this prediction is made
Six classes of signals go in along with 5 years of machine learning and data science. One explainable forecast per payer comes out.
- Benefit design
- True Plan Value™ (TPV)HealthWorksAI proprietary metric
- Enrollment history
- Service area changes
- Broker commissions
- Market conditions
*91.2% is last year's accuracy, a point in time that varies by segment, geography and forecast horizon. We have made these enrollment predictions for the past five years and continue to refine the data, models and data science. Predictions account for broker commissions as of 7 Oct 2026.
✓ Our record
Five years of predictions, measured against what actually happened.
Last year our enrollment models ran at 91.2%* accuracy against what actually happened. We have made and published these predictions for each of the past five years, and beginning this year, we forecast all three enrollment windows, not just AEP results.
*91.2% reflects last year's accuracy. Accuracy varies by segment, geography and forecast horizon, so a single figure should be read as a track record, not a guarantee for any one plan or market. We continue to refine the data, models and data science each year.
01 Footprint
What did pulling out of markets actually cost?
The 8 largest payers are forecast to release ~630K members. They call it refinement. The arithmetic calls it lost market share, and KFF's county counts show exactly where they went.
Who gains and who loses members by Feb 2027
Our xAI forecast of each payer’s member change from Sep 2026. Bigger tile, bigger change. Actual results land in Jan.
Devoted Health
enters 342 counties
UnitedHealth Group
exits 34 counties
Four other large payers
Humana, Centene, HCSC and BCBS Michigan combined; 910 county exits
County exit and entry counts from our platform, 7 Oct 2026. Member change is our forecast. "Four other large payers" combines Humana, Centene, HCSC and BCBS Michigan into one figure, so no single payer's prediction is published individually. *Last year's accuracy of our enrollment predictions; it varies by segment, geography and forecast horizon.
The implication. A footprint decision is also a membership decision, and its cost shows up later. The county map shows who moved. It does not show what the move costs.
02 Share
Those members do not disappear. They move.
Scale is not protecting share this year. Devoted Health alone is forecast to add ~455K members, close to doubling, on a 2027 footprint of 740 plans.
Forecast net member change, Sep 2026 to Feb 2027xAI forecast
Net change = predicted Feb 2027 members minus Sep 2026 members, the same measure for every row. Devoted Health grows from 531,137 to 986,287; UnitedHealth goes from 7,712,848 to 7,498,109; the 13 other payers go from 15,560,350 to 15,213,378 combined.
*"All other payers (13)" blends Alignment, BCBS Michigan, Centene, Clever Care, Clover Health, CVS Health, Elevance, HCSC, Humana, Kaiser, Molina, SCAN and UPMC into one figure, so no individual prediction is published for them.
The implication. The members leaving the largest payers are not leaving Medicare Advantage. They are choosing a competitor.
03 The market
Is Medicare Advantage really flat in 2027?
No. Two large movements cancel each other out, and only one of them is in your book. CMS publishes one national projection. We forecast 161 payers separately.
The implication. A flat headline is the least useful number in the market this year. It hides the changes by state, market and county underneath it, and by plan type within each.
04 The shift
Where are members actually moving?
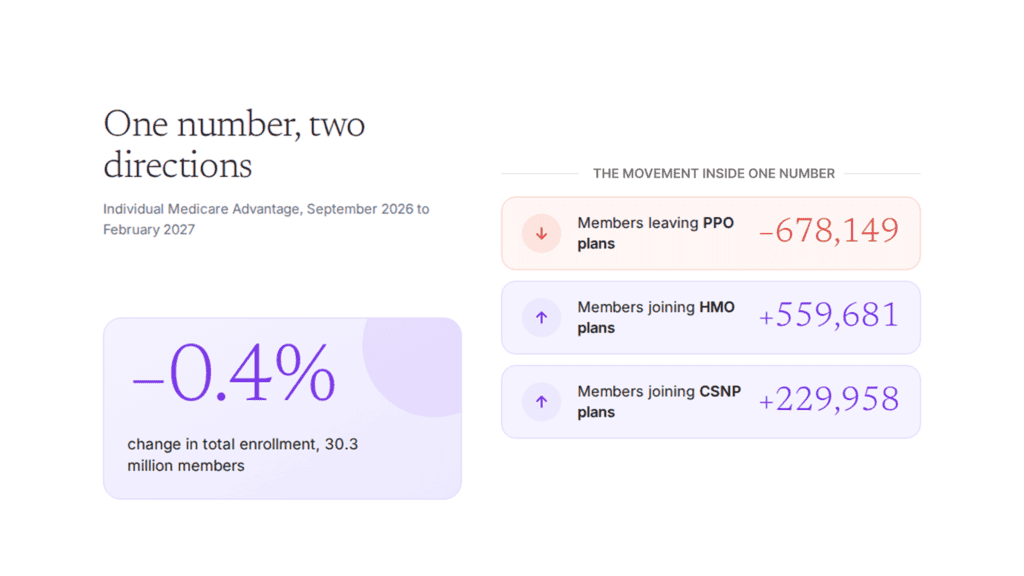
Out of PPOs. Into HMOs and CSNP plans. ~680K members change plan type, the largest rotation in years.
Where the members go, by plan type and special needs typexAI forecast
Plan-type and special-needs views are drawn from separate cuts of the landscape file and do not sum to the same total.
The implication. If your 2028 bid assumes the PPO book holds its shape, the forecast disagrees with you by ~680K members.
05 True Plan Value
What is a plan actually worth to a member?
The True Plan Value™ (TPV), a HealthWorksAI proprietary metric, is the benefit value a member realizes above traditional Medicare, per member per month. After declining steadily from 2024 to 2026, the metric experienced a small rebound in 2027 across the 20 largest payers.
Average relative True Plan Value, 20 largest payers, change year over year
Percentages show the change from the year before. Relative view: earlier years are restated under current-year policy. Figures are $PMPM, risk adjusted, Part C plus Part D plus Part B giveback.
True Plan Value for your market
Contact us to see your own True Plan Value, by county, state or bid
This page is the national view. We can show the same measure for your market, or any market you are focused on.
The implication. How deeply a payer cut its value tells you almost nothing about what happened to its membership, and value alone does not decide growth either. Both measure where a payer stands. Neither predicts where it lands on its own, which is why we treat them, and your own market's breakdown, as separate tools.
Proof from a customer
A national payer tested its benefit trade-offs and increased its projected yield by 3,700 members
Benefit value only pays off when you know which change moves enrollment. A leading national payer used our Benefit Simulator to test 81 benefit scenarios across 10 states before filing.
“Our enrollment predictions were subjective, lacking the hard data science needed for confident decision-making.” Chief Financial Officer, national Medicare Advantage payer
Your next move
Q3 Earnings season
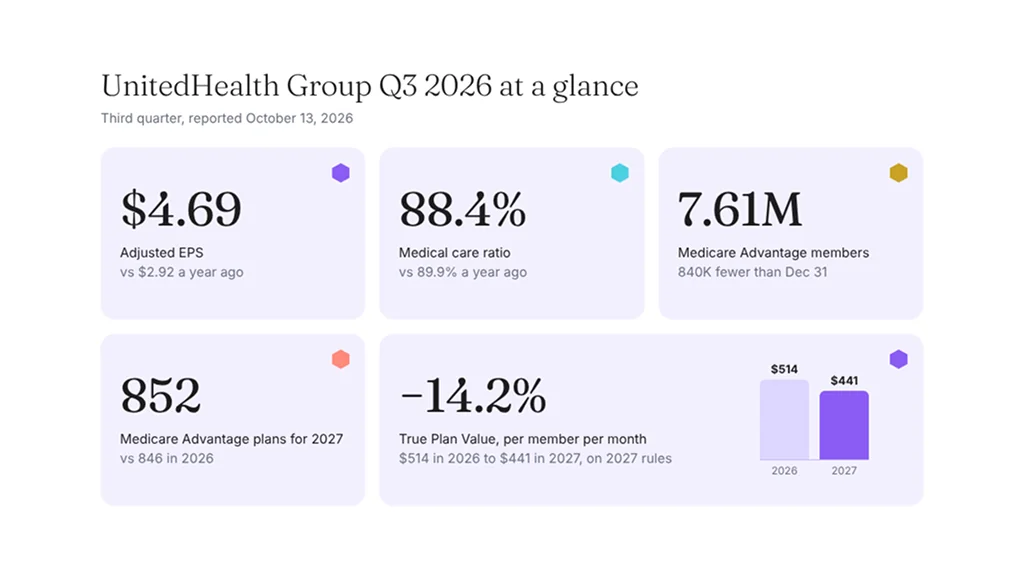
UnitedHealth Group reported first. Six more payers follow.
We read each Q3 2026 earnings call next to our AEP 2027 plan data. The UnitedHealth Group analysis is live now. The other payers follow as they report, then one roundup of all seven.
Coming next
- Elevance Health
- Molina Healthcare
- Centene
- Alignment Healthcare
- CVS Health
- Humana
- Roundup of all seven
 Out now
UnitedHealth Group Q3 2026 earnings: margins recover, and the 2027 Medicare Advantage map gets selective
Read the analysis →
Speak to our experts
Want this forecast for your markets?
This page is the national view. Our experts can take you through the same forecast by state, county and plan type, for your plans and your competitors, and what it means for your 2028 bid.
Questions we get asked
How much will Medicare Advantage enrollment change in 2027?
We forecast 30,179,988 individual MA members in Feb 2027, against 30,297,955 in Sep 2026. That is a fall of ~118K members, or 0.4%. The headline is close to flat, but the composition changes significantly.
Why is Medicare Advantage PPO enrollment falling in 2027?
We forecast PPO enrollment falling 678,149 members, or 6.7%, while HMO enrollment rises 559,681. Several national carriers reduced PPO footprints for 2027 and de-commissioned their plans, describing the change as footprint and product refinement on recent earnings calls.
Are CSNPs growing in 2027?
Yes. We forecast CSNP enrollment rising 229,958 members, or 12.6%, the fastest growth of any segment. D-SNP is broadly stable and I-SNP edges lower. CSNP growth does not offset the general enrollment decline of 360,893.
Has Medicare Advantage “True Plan Value” fallen for 2027?
Yes. Across the 20 largest payers, average relative True Plan Value™ (TPV) declined from $577 in 2024 to $485 in 2026, reflecting a multi-year downward trend. However, 2027 marks a modest rebound, with average TPV increasing to $494, an improvement of 1.9% year over year. Despite this uptick, average TPV remains below 2024 levels, indicating that payers continue to offer less value than they did three years ago. True Plan Value™ (TPV) is a HealthWorksAI proprietary metric: the benefit value a member realizes above traditional Medicare on a per member per month basis.
Which Medicare Advantage payers are forecast to gain the most members in 2027?
Devoted Health is forecast to grow from 531,137 to 986,287 members, up 85.7% on a 740-plan footprint.
How accurate are Medicare Advantage enrollment predictions?
Last year our enrollment predictions ran at 91.2% accuracy. Accuracy varies by segment, geography and forecast horizon, and we have made these predictions for five years, refining the data, models and data science each year.
Predictions account for broker commissions as of 7 Oct 2026. Any changes in broker commissions or other factors during AEP may change these predictions. AEP runs 15 Oct to 7 Dec 2026; actual enrollment data follows in early 2027. County exit and entry counts are from KFF, published 9 Oct 2026. CMS plan projections are from the CMS press release of 28 Sep 2026.