Be the first to read our insights
Get the latest Medicare Advantage, Medicaid, and Marketplace intelligence delivered straight to your inbox, and download this report as a PDF.
Thanks! Your download should start now. If it doesn't, open the PDF here.
Alignment Healthcare Q3 2026 earnings: growth beats plan, but the 2026 profit outlook resets lower
Alignment Healthcare reported revenue of $1.36 billion, up 36.7%, and about 301,200 members, then cut its 2026 adjusted EBITDA outlook to at least $100 million and filed 77 Medicare Advantage plans for 2027, up from 68. This page reads the earnings call, the stock reaction and HealthWorksAI's 2027 plan and enrollment data together.
Section 1
Executive summary: Alignment Healthcare Q3 2026 earnings takeaways
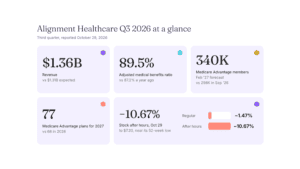
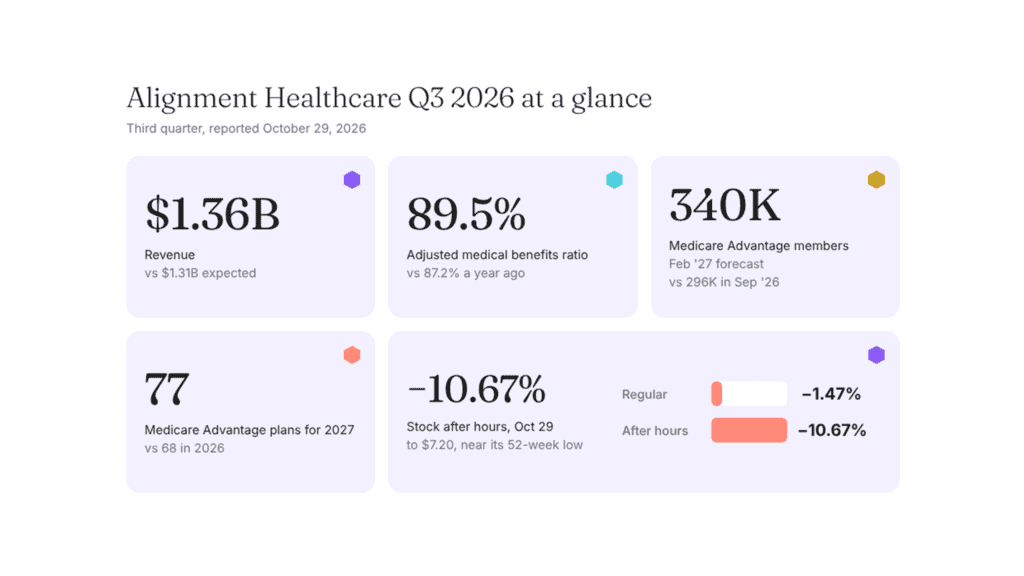
Alignment Healthcare Q3 2026 earnings pair strong growth with a profit reset. Revenue was $1.36 billion, up 36.7% and ahead of the $1.31 billion expected, and health plan membership reached about 301,200, up 31.2%. The adjusted loss of $0.04 per share was in line with expectations. The adjusted medical benefits ratio rose about 240 basis points to 89.5%, and adjusted EBITDA fell 32.8% to $21.8 million, inside the $20 million to $30 million range guided at Q2. Management raised full-year membership and revenue guidance, but cut adjusted gross profit to at least $575 million, from $630 million to $650 million, and adjusted EBITDA to at least $100 million, from $145 million to $163 million. It named three causes: provider appeals and disputes that rose after a claims system migration, catastrophic cases, and skilled nursing costs.
The stock fell. Shares closed the regular session on October 29, 2026 at $8.06, down 1.47%, then dropped another 10.67% after hours to $7.20, near the bottom of a 52-week range of $6.01 to $25.12. The 2027 Medicare Advantage data moves against the all-payer trend, where plans fall by a net 34: 77 plans against 68 and 55 counties against 45 (10 entered, none exited), while management targets membership growth of at least 20% for 2027. HealthWorksAI's relative True Plan Value™ for Alignment rises 7.3% for 2027, while the average across all payers falls 11.2%, and 32 of its 77 plans keep a $0 drug deductible. HealthWorksAI's enrollment forecast has Alignment at 340,342 Medicare Advantage members by February 2027, up 43,977 or 14.8% from 296,365 in September 2026.
1. Earnings
Revenue, third quarter, $ billion
Outlook cut to adjusted EBITDA of at least $100M, from $145M to $163M. Adjusted EPS of −$0.04 matched the forecast.
2. Medical benefits ratio
Share of revenue paid out as medical costs, adjusted
Up about 240 basis points from a year ago, and about 100 basis points above the implied midpoint of Q3 guidance. Axis 86% to 90%, lower is better.
3. Health plan members
Thousands, company-reported, September 30
+31.2% year over year. 2025 is derived from the reported growth rate. Management targets membership growth of at least 20% in 2027.
4. The 2027 plan map
Alignment Medicare Advantage plans in its three largest states, 2026 to 2027
20262027
77 plans against 68, and 10 counties entered, none exited. Scale 0 to 50 plans.
HealthWorksAI enrollment forecast
Alignment Medicare Advantage members, thousands, HealthWorksAI enrollment data and forecast
+14.8%
+43,977 members forecast by February 2027, from 296,365 in September 2026. Management targets at least 20% growth in 2027 on company-reported membership, a different basis.
5. True Plan Value™
HealthWorksAI's proprietary measure of benefit value. Relative average across Alignment plans
+7.3%
Alignment's relative average True Plan Value™ rises 44.6 points across its 77 plans for 2027, while the average across all payers falls 11.2%. It fell 5.4% for 2026 and is now 1.6% above 2025.
6. Stock reaction
ALHC on earnings day, October 29, 2026
A small slip in the regular session, then a sharp drop after hours as the guidance cut landed.
52-week range $6.01 to $25.12. After hours, the stock sat about 6% of the way up from its low.
Section 2
Key leadership commentary
The commentary below summarizes statements on Alignment Healthcare's Q3 2026 earnings call and its Q3 2026 results release, with two short verbatim quotes. The interpretations are ours.
On the quarter
Third-quarter membership and revenue growth show continued demand for Alignment's products, while medical trends ran higher than expected. The company is taking a prudent approach to the fourth quarter, and its revised guidance assumes no benefit from the actions already underway.
John Kao, Chairman and Chief Executive Officer, Alignment Healthcare
What this really means: growth is not the problem. Adjusted EBITDA landed inside the Q2 range, at the low end, but the full-year cut of at least $45 million from the bottom of the old range is the larger message, and it rests on cost visibility after the claims system change.
On 2027
“I would strongly advise not to use the Q4 MLR as an annualized starting point for 2027.”
John Kao, Chairman and Chief Executive Officer, Alignment Healthcare
What this really means: the Q4 guide implies a 92.1% medical benefits ratio and gives no credit for payment integrity or clinical actions. Management is asking investors not to treat the Q4 ratio as a run rate, and pointed to potential upside. It will share more on 2027 after annual enrollment results in January.
On Star Ratings
“Stars is not a functional department. Stars is a cultural requirement.”
John Kao, Chairman and Chief Executive Officer, Alignment Healthcare
What this really means: six of seven eligible plans hold 4 Stars or higher for payment year 2028, but the California HMO contract, where much of the membership sits, earned 3.5 Stars. Management tied the miss to triple-weighted HOS and Part D measures and higher industry cut points, which puts pressure on 2028 benefit funding in its largest market.
More from the call
On claims and appeals
Most of the move to the Facets claims system was done in July. Provider appeals and disputes peaked that month and have dropped off significantly in August, September and October.
John Kao, CEO
On the cost ratio
About half of the 240 basis point increase came from Part D seasonality and clinical investments flagged on the Q2 call. The rest came from appeals and disputes, skilled nursing and catastrophic cases.
Jim Head, CFO
On 2027 growth
Early AEP results support membership growth of at least 20%. Bids were reconciled to current trends, with changes to certain networks and to how fast some products grow.
John Kao, CEO
On new markets
Alignment enters San Antonio and Charlotte in 2027, chose not to add states this year, and is working to add a couple of states in 2028. New partners include Hoag Memorial in Orange County and Astrana in Los Angeles.
John Kao, CEO
On costs and cash
Adjusted SG&A was $120 million, 8.9% of revenue and 70 basis points better than a year ago. Operating cash flow was $158 million for nine months, with $743 million in cash and short-term investments.
Jim Head, CFO
On product mix
Margins on chronic condition special needs plan members have held up in the year, and mix was not a driver of the cost trend. The 2027 mix is expected to be more balanced toward HMO products.
John Kao, CEO
Section 3
Did they deliver on what we flagged last quarter?
Measured against the items in HealthWorksAI's Alignment Healthcare Q2 2026 Earnings Insight, covering the company's Q2 2026 earnings call.
| What we flagged in Q2 2026 | What actually happened in Q3 2026 | Verdict |
|---|---|---|
| Q3 adjusted EBITDA guided at $20 million to $30 million. | Adjusted EBITDA was $21.8 million, inside the range but near its low end, and down 32.8% from a year ago. | Delivered, low end |
| Full-year membership of 298,000 to 301,000 and revenue of $5.20 billion to $5.23 billion. | Raised again, to at least 305,000 members and at least $5.245 billion of revenue, on continued sales momentum. | Delivered, improved |
| Full-year adjusted gross profit of $630 million to $650 million and adjusted EBITDA of $145 million to $163 million. | Cut to at least $575 million and at least $100 million, reflecting higher medical costs in the third quarter. | Off track |
| Whether the second-half cost step-up, including double-digit millions of new investment, holds as guided. | Partly. The planned investments held as guided and sit in the Q3 numbers. The miss came from claims cost: the ratio was about 100 basis points above the implied Q3 midpoint, on appeals, disputes, skilled nursing and catastrophic cases. | Mixed |
| Whether the high-acuity, special needs heavy growth mix, about 50% of new members, continues into AEP 2027. | No new mix figure. Management expects a more balanced HMO mix in 2027, with chronic condition plans kept in some markets. HealthWorksAI data shows 20 of 77 plans for 2027 are chronic condition plans, against 19 of 68 for 2026. | Mixed |
| The first real signal on 2027 market entry, inside existing states, with new states not before 2028. | Named: San Antonio and Charlotte, both inside existing states, with a couple of new states planned for 2028. HealthWorksAI data shows 10 counties entered and none exited. | Delivered |
| An update on the claims auto-adjudication rate and on RADV, both quiet at Q2. | Neither figure was given. Management said the Facets migration was made for better auto-adjudication and payment integrity. RADV was not addressed. | Pending |
This scorecard shows three of seven items delivered, one of them improved on plan, one off track, two mixed and one pending. The open items are the profit reset and the California HMO Star Rating, which was not on the Q2 watch list.
Section 4
What's actually changing
Growth beat the plan, and profit did not follow
Revenue of $1.36 billion was 3.8% ahead of the $1.31 billion expected, and membership grew 31.2% to about 301,200. The adjusted loss of $0.04 per share matched the forecast. The cost side moved the other way: the adjusted medical benefits ratio rose to 89.5% from 87.2%, and adjusted EBITDA of $21.8 million was a 1.6% margin. Adjusted SG&A improved to 8.9% of revenue, helped in part by lower incentive compensation accruals.
Medical benefits ratio
Share of revenue paid out as medical costs, adjusted
Axis runs 86% to 90%. Lower is better. Both values are calculated from the release.
Q3 EBITDA against the Q2 guide
Adjusted EBITDA, $ million
Scale $0 to $40M. Inside the range, near the low end. A year ago, Q3 adjusted EBITDA was $32.4M.
Adjusted SG&A ratio
Share of revenue, third quarter
Bar scale is 0% to 10%. 70 basis points better, partly from lower incentive compensation accruals.
The stock: a revenue beat, then an after-hours drop
Investing.com's transcript article reports that shares closed the regular session on October 29, 2026 at $8.06, down 1.47% from an $8.18 prior close, then fell another 10.67% after hours to $7.20, against a 52-week range of $6.01 to $25.12. Revenue beat the forecast by about $50 million, or 3.82%, and adjusted EPS matched it, so the move tracks the cut to full-year profit guidance rather than the quarter itself. After Q2 the shares also fell despite a beat, which our Q2 report tied to the second-half share of EBITDA dropping to about 30%. These readings come from one source and do not reflect the next full trading session.
Earnings-day path
Move in each period, %
The regular session closed before the 5 p.m. EDT call. The after-hours move is measured from the $8.06 close.
52-week range
ALHC share price, $
Range $6.01 to $25.12. $7.20 is about 6% of the way from the low to the high.
What the market reacted to
Full-year adjusted EBITDA guide, $ million
Bar scale is $0 to $163M. The new floor sits $45M below the old low end.
Costs: appeals, disputes and a claims system change
Alignment moved to the Facets claims system to raise auto-adjudication and payment integrity. During the change, paid claims became volatile and provider appeals and disputes rose sharply, peaking in July, while catastrophic cases and skilled nursing stays also ran high. Management says institutional acute cost trends stabilized in late September and October, but the Q4 guide assumes appeals and disputes stay at peak rates, and gives no credit for payment integrity or clinical programs whose costs are already included.
Where the ratio increase came from
Year-over-year rise in the medical benefits ratio, about 240 basis points
Split as described by the CFO on the call.
Medical benefits ratio by quarter
Adjusted, %
Bar scale is 80% to 95%. Management advised against using the Q4 ratio as a 2027 starting point.
Star Ratings: six of seven plans at 4 Stars or higher, and California at 3.5
For payment year 2028, based on 2025 dates of service, Alignment holds 4 Stars or higher in six of its seven eligible plans, three of them at 4.5 Stars. Its California HMO contract earned 3.5 Stars, below management's expectations, on misses in triple-weighted HOS and Part D measures and higher cut points. Management says fixes to HEDIS gap closure, Part D data and provider engagement are in place for the 2026 performance year, and that brokers have not changed their view so far.
Eligible plans by Star Rating
Payment year 2028, seven eligible plans
The one plan below 4 Stars is the California HMO contract.
California's three largest payers
Medicare Advantage plans, 2026 to 2027
20262027
SCAN 54 to 66, Kaiser 48 to 48, Alignment 40 to 46, while California falls 2.0% to 394 plans. 46 of Alignment's 77 plans are in California. Scale 0 to 70 plans.
The 2027 map: 77 plans, up from 68
Alignment goes from 68 Medicare Advantage plans to 77, while plans across all payers fall by a net 34, and from 45 counties to 55, entering 10 and exiting none. The new counties are Bexar and Comal around San Antonio, Cabarrus, Gaston, Mecklenburg and Rowan around Charlotte, Kern, Kings and Tulare in California, and Nye in Nevada. California plans rise from 40 to 46, making Alignment the third-largest payer there by plan count after SCAN and Kaiser, Texas plans from 7 to 10 and North Carolina from 7 to 8, while Nevada falls from 8 to 6. Special needs plans are 25 of 77, or 32.5%. On drug deductibles, 32 plans keep a $0 deductible, down from 39, and 42 sit in the top $700 tier against 27 at $615 in 2026. Counts come from HealthWorksAI's analysis of the CMS 2027 plan benefit and crosswalk files.
Plans by state
Alignment Medicare Advantage plans, 2026 to 2027
20262027
California 40 to 46, Texas 7 to 10, North Carolina 7 to 8, Arizona 6 to 7, Nevada 8 to 6. Scale 0 to 50 plans.
Total plans
Alignment Medicare Advantage plans, 2026 to 2027
+9 plans, or +13.2%, while all payers together fall from 5,592 to 5,558.
Counties entered and exited
45 counties in 2026 to 55 in 2027, a net gain of 10
Alignment entered 10 counties and exited none. A county counts as exited only when Alignment has no plan left in it.
Special needs plans, share of 2027 plans
Alignment 25 of 77 plans, against 35% for all payers
Alignment, 32.5%
All payers, 35%
Plans with a $0 drug deductible
Alignment 32 of 77 plans in 2027, against 450 of 5,558 for all payers
Alignment, 41.6%
All payers, 8.1%
Down from 39 of 68 Alignment plans in 2026, and 704 of 5,592 for all payers.
Top drug deductible tier, Alignment plans
The tier moved from $615 in 2026 to $700 in 2027
+55.6% in count, from 39.7% of plans to 54.5%. A higher count in a higher tier says little about member costs on its own.
True Plan Value™ rebounds while the market falls
HealthWorks AI TPV™ (True Plan Value) is a proprietary measure of the value of plan benefits members realize above and beyond traditional Medicare, across Part C, Part D and Part B giveback. Alignment's relative average falls from $642.8 in 2025 to $608.2 in 2026, then rises to $652.8 in 2027, a gain of 7.3% that puts it 1.6% above 2025. Across all payers, the relative average falls from $502.8 to $446.5 for 2027, down 11.2%.
Alignment relative average True Plan Value™
Relative average across Alignment plans, 2025 to 2027
Year-over-year change in True Plan Value™
Relative average
Bar scale is 0% to 11.2% in size. Averages blend plan and county mix, so read the direction more than the decimals.
From the HealthWorksAI desk · The 2028 bid
Alignment grew its map and raised its benefit value. Both were bid decisions.
9 more plans, 10 new counties across Texas, North Carolina, California and Nevada, 32 plans still at a $0 drug deductible, and True Plan Value™ up 7.3% while the market average fell 11.2%. Alignment bid to grow, then cut its 2026 profit outlook in the same quarter. With management targeting at least 20% membership growth in 2027 and HealthWorksAI forecasting 340,342 members by February, up 14.8%, the question for 2028 is where that growth comes from in your counties, and which benefits would hold your members. That can be modeled, benefit by benefit, before anything is filed.
How plans test a benefit change before they bid →Section 5
Where the guidance goes from here
2026 adjusted EBITDA guide
Full year, $ million
Scale $80M to $180M. The new figure is a floor, not a range.
2026 adjusted gross profit guide
Full year, $ million
Scale $550M to $670M. Nine-month adjusted gross profit was $471M.
2026 membership guide
Year end, thousands
Scale 290K to 310K. Members were about 301,200 at September 30.
Section 6
How the competitive picture is shifting
Alignment is growing its map while large peers shrink theirs
It goes from 68 plans to 77 and from 45 counties to 55, and grows 15.0% in California while the state's plan count falls 2.0%. Meanwhile Centene goes from 303 plans to 210 and Molina from 83 to 43, per HealthWorksAI's analysis of CMS data. HealthWorksAI's enrollment forecast shows the same split, with Alignment up 14.8% by February 2027 while Centene is forecast down 19.7% and Molina down 18.8%.
The pressure is cost visibility, not demand
Membership grew 31.2% and revenue 36.7%, while the medical benefits ratio rose about 240 basis points on appeals, disputes and high-cost cases after a claims system change.
California concentration meets a Stars miss
46 of Alignment's 77 plans for 2027 are in California, where its HMO contract earned 3.5 Stars for payment year 2028.
The market sold the guidance, not the quarter
Revenue beat and EPS matched, yet shares fell 10.67% after hours to $7.20, near the low end of a 52-week range of $6.01 to $25.12.
Beyond the quarter: Alignment signals from the release and the call
Cash and debt
September 30, 2026, $ million
Cash includes short-term investments, per the call. Funded leverage was 2.4 times trailing EBITDA.
Operating cash flow
Nine months, $ million
Nine-month net income was $39.9M, against $10.0M a year ago.
Membership
Health plan members, thousands
Company-reported membership. Bar scale is 0 to 305K.
Section 7
What this means for your plan
If you compete with Alignment in California
46 of its 77 plans for 2027 are in California, where its HMO contract earned 3.5 Stars for payment year 2028. Management says broker feedback has not changed so far, and that 2028 benefit design in California will weigh margin against growth.
If you run Medicare Advantage around San Antonio or Charlotte
Alignment enters Bexar and Comal counties in Texas, and Cabarrus, Gaston, Mecklenburg and Rowan in North Carolina, for 2027. It is a new name on the plan list during this annual enrollment period.
If you serve members with chronic conditions
20 of Alignment's 77 plans for 2027 are chronic condition special needs plans. Management says those members have performed well in the year, and expects a more balanced HMO mix for 2027.
If you look at benefit value
True Plan Value™ describes the value of benefits members realize. Alignment's rises 7.3% for 2027 while the all-payer average falls 11.2%, and 32 of its 77 plans keep a $0 drug deductible, so averages blend plan and county mix.
Reading note: HealthWorksAI's enrollment count of 296,365 in September 2026 and Alignment's reported membership of about 301,200 at September 30 use different bases, so the two figures do not match. HealthWorksAI's forecast is 340,342 members for February 2027, up 43,977 or 14.8% on its own September base.
How HealthWorksAI helps you act on this
HealthWorksAI brings payer moves by county, benefit value by plan and network fit into one platform, so a plan team can see where a competitor's 2027 map overlaps its own markets.
Your next move
From what changed in 2027 to what your team does about it
The 2028 bid, this AEP's enrollment and next year's network plan all start from these shifts. Here is where each team picks them up.
Common questions
Alignment Healthcare Q3 2026 earnings: common questions
What were Alignment Healthcare's Q3 2026 results?
Alignment Healthcare reported revenue of $1.36 billion for Q3 2026, up 36.7% and ahead of the $1.31 billion expected, with health plan membership of about 301,200, up 31.2%. The adjusted loss of $0.04 per share matched expectations. The adjusted medical benefits ratio was 89.5%, up about 240 basis points, and adjusted EBITDA was $21.8 million, a 1.6% margin.
Did Alignment Healthcare change its 2026 guidance?
Yes. It raised membership to at least 305,000 and revenue to at least $5.245 billion, and lowered adjusted gross profit to at least $575 million, from $630 million to $650 million, and adjusted EBITDA to at least $100 million, from $145 million to $163 million. Fourth-quarter adjusted EBITDA is guided to at least negative $28 million, an implied medical benefits ratio of 92.1%.
Why did Alignment Healthcare lower its profit outlook?
Management cited a rise in provider appeals and disputes after its move to the Facets claims system, which peaked in July, plus higher costs in catastrophic cases and skilled nursing. The fourth-quarter guide assumes those costs continue at peak rates and includes no benefit from payment integrity or clinical programs already underway.
How did Alignment Healthcare's stock react to Q3 2026 earnings?
According to Investing.com, shares closed the regular session on October 29, 2026 at $8.06, down 1.47% from an $8.18 prior close, then fell 10.67% after hours to $7.20, against a 52-week range of $6.01 to $25.12. These readings do not reflect the next full trading session.
What is Alignment Healthcare's True Plan Value™ for 2027?
HealthWorksAI's True Plan Value™, a proprietary measure of benefit value, averages $652.8 on a relative basis across Alignment's 77 Medicare Advantage plans for 2027, against $608.2 for 2026, a 7.3% increase. The average across all payers falls 11.2%, from $502.8 to $446.5.
How many Medicare Advantage plans will Alignment Healthcare offer in 2027?
HealthWorksAI's analysis of CMS data shows 77 Alignment Medicare Advantage plans for 2027 against 68 in 2026, in 55 counties against 45, with 10 entered and none exited. New counties include Bexar and Comal around San Antonio and four counties around Charlotte. California plans rise from 40 to 46.
How many Medicare Advantage members does Alignment Healthcare have?
Alignment reported about 301,200 health plan members at September 30, 2026, up 31.2% from a year earlier, and guides to at least 305,000 by year end. Management targets membership growth of at least 20% in 2027. HealthWorksAI's enrollment data shows 296,365 Alignment Medicare Advantage members in September 2026, on a different basis. Its forecast for February 2027 is 340,342, up 43,977 or 14.8%.
What happened to Alignment Healthcare's Star Ratings?
For payment year 2028, Alignment holds 4 Stars or higher in six of its seven eligible plans, three of them at 4.5 Stars. Its California HMO contract earned 3.5 Stars, which management tied to triple-weighted HOS and Part D measures and higher industry cut points.