UnitedHealth Group Q3 2026 Earnings Insight: Critical Takeaways
This report is a HealthWorksAI breakdown of UnitedHealth Group's Q3 2026 earnings call and its 2027 Medicare Advantage plan footprint, with a scorecard against our Q2 2026 report, key leadership quotes, guidance, and what it means for competing health plans.
Section 1
Executive summary: UnitedHealth Group Q3 2026 earnings takeaways
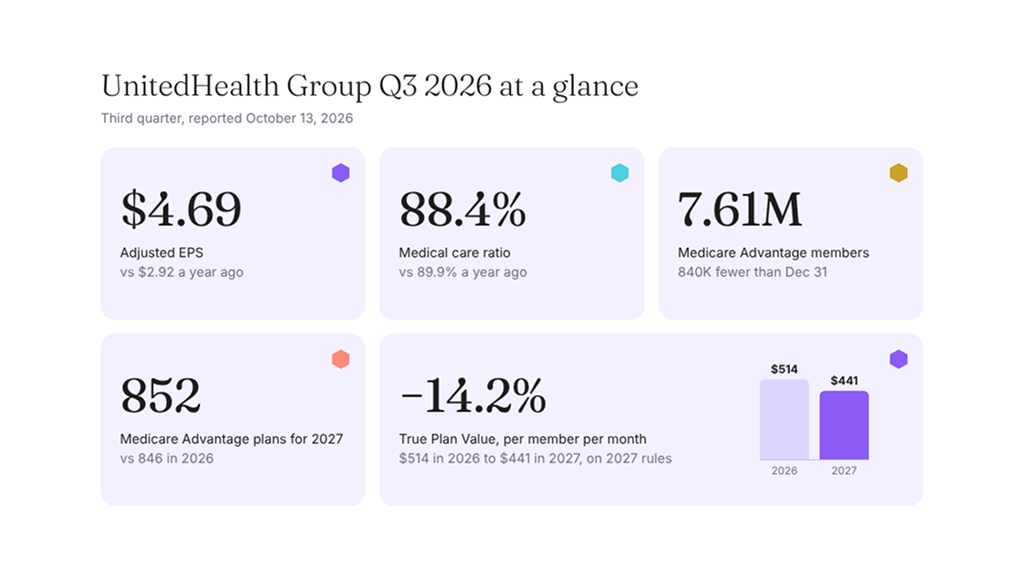
UnitedHealth Group Q3 2026 earnings strengthen the case for its turnaround. Adjusted EPS was $4.69 against $2.92 a year earlier, revenue was $112.7 billion, and the full-year outlook was raised to at least $20.50. The medical care ratio fell to 88.4% from 89.9%, although $610 million of favorable reserve development for 2026 services supported the result, so the improvement is best read alongside that reserve benefit, not as wholly recurring savings.
The 2027 Medicare Advantage data points to selective repositioning: 852 plans against 846 and a net gain of four counties, with fewer plans in Texas, Florida and California. HealthWorksAI's True Plan Value for UnitedHealth falls 14.2%, from $514 to $441 per member per month on 2027 rules, against 11.2% fall for Medicare Advantage as a whole.
See the key leadership quotes in Section 2, the full scorecard in Section 3, and what this means for your plan in Section 7.
1. Earnings
Adjusted EPS, third quarter
Outlook raised to at least $20.50, from $19.50 to $20.00. Revenue $112.7B, against $113.2B.
2. Medical care ratio
Share of premiums paid out as medical costs
1.5 points better than a year ago, with $610M of favorable reserve development behind it. Axis 86% to 91%, lower is better.
3. Medicare Advantage members
UnitedHealthcare, millions, as reported
840K fewer than in December, 40K more than in June.
4. The 2027 plan map
UnitedHealth Medicare Advantage plans, 2026 to 2027
20262027
852 plans against 846, net +4 counties, and 42.5% of plans are special needs plans.
5. True Plan Value
HealthWorksAI's proprietary measure of benefit value, $ per member per month. 2026 restated on 2027 rules
−14.2%
UnitedHealth's average True Plan Value falls $73 across its 852 plans, against −11.2% for Medicare Advantage as a whole.
Section 2
Key leadership quotes
The quotes below are verbatim from UnitedHealth Group's Q3 2026 earnings remarks and its earnings release. The interpretations are ours.
On enterprise recovery
“Our businesses are improving.”
Stephen Hemsley, Chairman and Chief Executive Officer, UnitedHealth Group
What this really means: the recovery claim is best tested against annual and sequential results, with reserve effects set apart from the run rate.
On medical cost management
“Costs remain stubbornly high across the entire healthcare landscape…”
Tim Noel, Chief Executive Officer, UnitedHealthcare
What this really means: consistent with the benefit trimming seen across payers for 2027, and a reason to keep prudent utilization assumptions in view.
On the growth outlook
“…current analyst consensus for 2027 may understate the opportunity ahead.”
Wayne DeVeydt, Chief Financial Officer, UnitedHealth Group
What this really means: an optimistic signal for next year. A full 2027 outlook has not been published yet.
More from the call and the release
On the quarter
“Our third quarter results reflect the discipline and execution our teams are bringing to every part of our business,”
Stephen Hemsley, Chairman and CEO. Earnings release
On execution
“Third quarter results reflect continued progress across the enterprise and improving execution in our businesses…”
Wayne DeVeydt, CFO
On Star Ratings
“…we expect to approach 75% of total members in four-plus Star plans compared to the industry average of 70%.”
Tim Noel, CEO, UnitedHealthcare
On Medicare reach
“More than 94% of Medicare-eligible individuals nationwide will have access to a UnitedHealthcare Medicare plan…”
Tim Noel, CEO, UnitedHealthcare
On AI in care
“We have expanded AI-enabled chart summarization to more than 40% of our employed clinicians…”
Stephen Hemsley, Chairman and CEO
On Optum Health margins
“…pacing appropriately towards our 6%-8% target margin range, but see ample opportunity for growth inside Optum Health.”
Krista Nelson, Optum Health
Section 3
Did they deliver on what they promised last quarter?
Measured against HealthWorksAI's own UnitedHealth Group Q2 2026 Earnings Insight report, covering the company's July 16, 2026 earnings call, which flagged five commitments and watch items worth tracking into Q3.
| What we flagged after Q2 2026 | What actually happened in Q3 2026 | Verdict |
|---|---|---|
| Full-year adjusted EPS outlook of $19.50 to $20.00. | Raised to at least $20.50. | Delivered |
| Share repurchases of at least $5.0 billion in 2026. | $5.0 billion repurchased through September. | Delivered |
| Medicare Advantage decline near 1.1 million for the year, with margin above 3%. | Members are 840K lower since December and up 40K since June. Margin is now expected near the top of a 2% to 4% range. Formal full-year membership guidance is still to come. | On track |
| Medical care ratio holds near its Q2 range without more reserve help. | 88.4%, up from 86.7% in Q2, and still supported by $610 million of favorable reserve development (Q2: $860 million). | Mixed |
| Return metrics on the $1.5 billion AI investment. | Operating results cited on the call: chart review time down 33%, appeal cycle times down 26%. No return figure was found. | Partial |
This scorecard shows two of five items delivered cleanly and one on track. The medical care ratio and the AI return metrics are the open cases: real progress on paper, with the cleaner test still ahead.
Section 4
What's actually changing
The medical care ratio improved on last year, and reserves still helped
The ratio of 88.4% is 1.5 points better than Q3 2025 and up from 86.7% in Q2. Favorable reserve development of $610 million (Q2: $860 million) supported the quarter, and Optum Health's margin of 3.2% is up from 0.2% a year ago but below Q2's 5.1%.
Medical care ratio
Share of premiums paid out as medical costs
Axis runs 86% to 91%. Lower is better.
Favorable reserve development
Net, prior periods, $ million
Optum Health operating margin
Percent of revenue
Medicare Advantage membership fell early in the year and steadied in Q3
UnitedHealthcare reports 7,605,000 Medicare Advantage members at September 30, 2026: 840,000 fewer than at December 31, 2025, and 40,000 more than at June 30.
Company-reported Medicare Advantage members
UnitedHealthcare, millions, as reported
Change in members, by period
Thousands, UnitedHealthcare Medicare Advantage
Jun 30, 2026Jun 30 to
Sep 30, 2026
−880K in the first half, +40K in the third quarter. Most of the decline came in the first half. The third quarter added members.
The rest of the industry is making similar moves for 2027
Across Medicare Advantage, plan counts are down again, $0 drug deductibles are thinning out, and several large payers cut dental, according to Healthcare Dive.
Members affected by dental cuts
Share of each payer's members, 2027
Plans with a $0 drug deductible
All payers, Medicare Advantage
Plan type change, 2027
All payers. 5,558 plans in total, down 34
35% of all plans are special needs plans. Insurers expect Medicare Advantage enrollment to fall 6% to 34 million.
The 2027 map is stable in total and selective underneath
UnitedHealth adds 6 plans and 4 counties on net (38 entered, 34 exited). Three large states lose plans while every other state combined gains 29. Special needs plans are 362 of its 852, or 42.5%. Counts come from HealthWorksAI's analysis of the CMS 2027 plan benefit and crosswalk files.
Plans in the three largest states
UnitedHealth Medicare Advantage plans, 2026 to 2027
20262027
Texas 90 to 80, Florida 69 to 57, California 43 to 42. Every other state combined: 644 to 673. Scale 0 to 100 plans.
Counties exited, by state
34 exits and 38 entries, a net gain of 4 counties (2,787 to 2,791)
Special needs plans, share of 2027 plans
UnitedHealth 362 of 852 plans, against 35% for all payers
UnitedHealth, 42.5%
All payers, 35%
Top drug deductible tier, UnitedHealth plans
The tier moved from $615 in 2026 to $700 in 2027
A lower count in a higher tier says little about member costs on its own.
True Plan Value falls faster for UnitedHealth than for the market
True Plan Value (TPV) is HealthWorksAI's proprietary measure of the value of plan benefits members realize above and beyond traditional Medicare, in dollars per member per month, across Part C, Part D and Part B giveback. On 2027 rules, UnitedHealth's average falls 14.2%, from $514 to $441, against 11.2% fall for Medicare Advantage as a whole.
UnitedHealth True Plan Value
$ per member per month, across 852 plans. 2026 restated on 2027 rules
Change in True Plan Value, 2026 to 2027
On 2027 rules
All Medicare Advantage moves from $503 to $447. Averages blend plan and county mix, so read the direction more than the decimals.
Management pointed to operating and quality markers alongside the ratio
The call cited fewer prior approvals, AI-assisted chart review and appeals, a lead on Star Ratings, and cost pressure in commercial and Medicaid.
Cutting friction
Reduction against the starting point
Prior approvals is the target for end of 2026, with nearly two-thirds of pediatric requirements removed. Chart review and appeals are results from AI tools; chart summarization now reaches over 40% of employed clinicians.
Quality and reach
Share of members or eligible people
The 75% figure is a forward expectation. UnitedHealthcare is also introducing AI-powered plan recommendations for this AEP.
Margin by line, 2026
Operating margin against its range or target
Medicaid band is the Q2 guide of −1% to −1.7%; 2026 is the trough year. Optum Health's 6% to 8% target is paced toward 2028.
Cost pressure
Management's own words: costs remain stubbornly high
Management said commercial trends are exceeding its initial expectation of 11%, with No Surprises Act costs, clinician cost intensity and high-cost specialty drugs. Bar scale is 0 to 20%.
Management described a stubborn gap between state funding and medical cost trends, and called 2026 the trough year for core Medicaid margins.
From the HealthWorksAI desk · The 2028 bid
Every line of this map was a bid decision. The next one is already underway.
Footprint, special needs mix, the $700 deductible tier, dental: each was a trade-off between margin and membership, settled in the bids filed this June. With UnitedHealth's True Plan Value down 14.2% against 11.2% for the market, the useful question for 2028 is what your members would do if you cut the same thing, or kept it when others did. That can be modeled, benefit by benefit, before anything is filed.
How plans test a benefit change before they bid →Section 5
Where the guidance goes from here
Capital returned to shareholders, year to date
$ billion
Dividends are expected to exceed $8 billion for 2026. The Foundation commitment is $1 billion.
Debt-to-capital
At September 30, 2026, against the year-end target
Up from 41.2% in Q2.
Section 6
How the competitive picture is shifting
The footprint is geographically uneven
A small national expansion sits alongside double-digit plan reductions in Texas (−11.1%) and Florida (−17.4%), so opportunities are best read at county and product level.
Special needs products stand apart
UnitedHealth's 362 SNP plans are 42.5% of its 852, against 35% for all payers. An all-plan average would hide the difference.
Quality is a lever
At least 69% of members are in 4+ Star plans on the 2027 results, and management expects to approach 75%, against an industry average of 70%.
Beyond Medicare Advantage: Optum signals from the call
Optum Rx members outside UnitedHealthcare
Share of Optum Rx covered lives
First time above half. Client retention is in the high 90s. Specialty volumes rose 2.6%.
Optum Integrity One clients
Revenue cycle coding automation. Launched end of 2025 with 2 clients
Integrity One automates claims coding in the revenue cycle.
Optum Health care delivery
Against a year ago
Behavioral engagement is above 90%.
Section 7
What this means for your plan
If you compete in Texas, Florida or California
A lower state plan count does not by itself show a county withdrawal or how many members are displaced. County-level detail is the next layer to look at.
If you compete in special needs plans
D-SNP and C-SNP serve different members under different rules, and local networks matter. An all-plan average blends them.
If you benchmark medical management
The 88.4% is a consolidated ratio across UnitedHealth's businesses, not the Medicare Advantage book alone, and it includes reserve development.
If you look at benefit value
True Plan Value describes the value of benefits members realize. It does not measure enrollment, margin or Star Ratings, and averages blend plan and county mix.
Reading note: a county counts as exited only when UnitedHealth has no plan left in it, so plan-level changes can be larger than county-level ones.
How HealthWorksAI helps you act on this
HealthWorksAI brings payer moves by county, benefit value by plan and network fit into one platform, so a plan team can see where a competitor's 2027 map overlaps its own markets.
Your next move
From what changed in 2027 to what your team does about it
The 2028 bid, this AEP's enrollment and next year's network plan all start from these shifts. Here is where each team picks them up.
Common questions
UnitedHealth Group Q3 2026 earnings: common questions
What were UnitedHealth Group's Q3 2026 results?
UnitedHealth Group reported adjusted earnings of $4.69 per share for Q3 2026, against $2.92 a year earlier, on revenue of $112.7 billion against $113.2 billion. The medical care ratio was 88.4% against 89.9%. The company raised its 2026 adjusted EPS outlook to at least $20.50.
Did UnitedHealth raise its 2026 guidance?
Yes. Adjusted EPS is now expected to be at least $20.50, up from the $19.50 to $20.00 range set after Q2. GAAP EPS is expected to be at least $19.50.
Why does reserve development matter for UnitedHealth's medical care ratio?
The Q3 ratio of 88.4% included $610 million of net favorable prior period reserve development for 2026 services, compared with $860 million in Q2. Reserve development lowers the reported ratio without reflecting current-quarter medical costs, so the improvement is best read alongside it.
What is UnitedHealth's True Plan Value for 2027?
HealthWorksAI's True Plan Value, a proprietary measure of benefit value in dollars per member per month, averages $441 across UnitedHealth's 852 Medicare Advantage plans for 2027, against $514 for 2026 restated on 2027 rules. That is a 14.2% decline, compared with an 11.2% fall for Medicare Advantage as a whole.
How many Medicare Advantage members does UnitedHealthcare have?
UnitedHealthcare reported 7,605,000 Medicare Advantage members at September 30, 2026. That is 840,000 fewer than the 8,445,000 at December 31, 2025, and 40,000 more than the 7,565,000 at June 30, 2026.
How many Medicare Advantage plans will UnitedHealth offer in 2027?
HealthWorksAI's analysis of CMS data shows 852 UnitedHealth Medicare Advantage plans for 2027 against 846 in 2026, in 2,791 counties against 2,787. Texas falls from 90 to 80 plans, Florida from 69 to 57 and California from 43 to 42. Special needs plans are 362 of the 852, or 42.5%.
What share of UnitedHealth members are in 4+ Star plans?
UnitedHealth said at least 69% of its Medicare Advantage members are in 4+ Star plans on the 2027 Star Ratings results. Management expects to approach 75%, against an industry average of 70%.
What did UnitedHealth say about 2027?
Management pointed to the 13% to 16% long-term earnings growth range. The CFO called its lower end a more reasonable starting point than analyst consensus for 2027, and the company said more detail on 2027 will come before year end. No formal 2027 outlook has been published yet.