
1. General Overview
1.1. National Overview
1.2. State Overview
1.3. MA/MAPD Overview
2. Plan Type Overview
2.1. SNP type Overview
2.2. Plan type Overview (Non-SNP)
3. Premium and Cost factors
3.1. Premium
3.2. HMO and PPO Deep dive
3.3. Zero Premium Expansion
3.4. Drug Deductibles
3.5. In Network MOOP
4. Benefit Overview
4.1. Supplemental Benefits
4.2. Enhanced Benefits
Medicare Advantage (MA), a private alternative to traditional Medicare, represents one of the fastest-growing sectors in the health insurance market. Each year, as the Medicare-eligible population continues to grow, so does the percentage of those seniors selecting Medicare Advantage over traditional Medicare, with national penetration now nearing 50%.
By the end of September 2022, more than 28 million people were enrolled in MA, with over 1 million more expected by the end of the 2023 Annual Enrollment Period (AEP).
However, operating a successful Medicare Advantage plan can be difficult, especially when customer choice and competition proliferate. Hence, to satisfy the rising demand, Payors nationwide raised the number of plans available for 2023 by 342, a jump of 6%.
According to the AEP data released by CMS in October 2022, this study outlines the important Plan & Benefit trends for the 2023 Medicare Advantage market. Specifically, this report contains changes in the MA market year-over-year (YoY) along with variations according to plan type, cost structures, and benefit categories, primarily briefed at the national level.
1. General Overview
At the highest level, we can easily see the indicators of the MA market’s rapid growth, made evident by the total number of plans available in 2023, double what consumers had access to in 2017.
From a distribution perspective, Florida alone, as you will find, accounts for more than 10% of all plans, with the following four states holding rank in the top five from 2017 to 2023 being California (8.5%), New York (6.8%), Texas (4.8%), and Pennsylvania (4.6%). The top States with the highest inclusion of the New Plans in 2023 are Florida, California, Texas, Pennsylvania, and Ohio.
1.1 National Overview
The number of plans in the Medicare Advantage market has more than doubled since 2017.
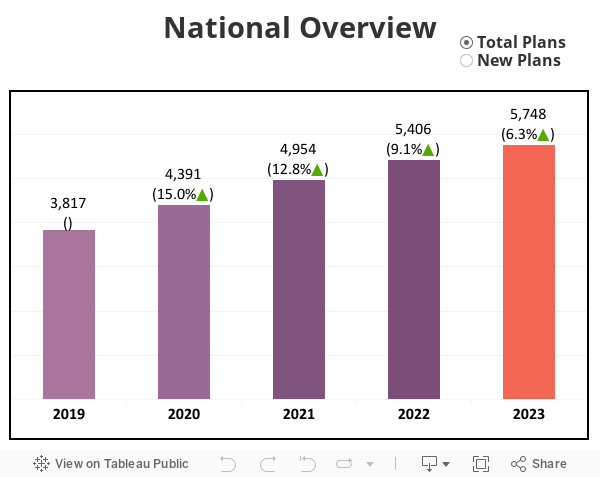
In 2023, the total number of available Medicare Advantage plans will increase to 5,748, a growth of 6.3% YoY. This includes 881 New Plans, accounting for 15.3% of the total, a similar ratio to 2022.
However, this is a reduction in the trend from previous years, including 2020 and 2021, where the ratios had been 19.1% & 18.1%, respectively.
1.2 State Overview
Though the top 5 largest Medicare Advantage States will add the highest number
of New Plans, opportunity markets continue to rise.
Though the top 5 largest Medicare Advantage States will add the highest number of New Plans, opportunity markets continue to rise.
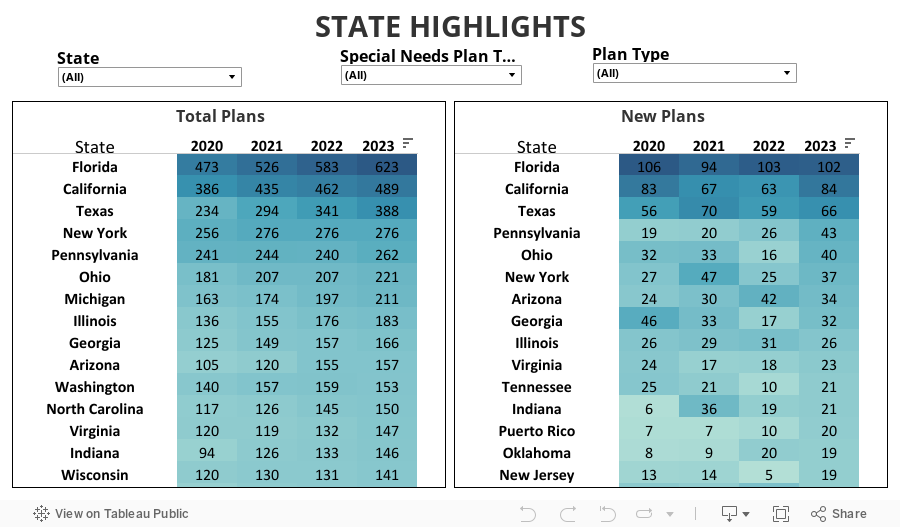
As mentioned in the section introduction, Florida bags the highest total number of Bid IDs (623) in the country, followed by California (489), Texas (388), New York (276), and Pennsylvania (262). Florida, California, and Texas continue to crown the highest number of New Plans in 2023.
In emerging markets, Wyoming (58.3%), Puerto Rico (35.3%), Oklahoma (22.7%), Alabama (18.7%), and Delaware (17.9%) showed the highest YoY increase in the total number of plans, while the significant decrease was seen in New Hampshire (-2.3%), Montana (-3.7%), Washington (-3.8%), Vermont (-3.9%), Maine (-5.3%), and Oregon (-6.1%). The average YoY growth for total plans among States is 8.5%.
Multiple states recorded no New Plans introduced for 2023, including some with large plan counts, such as New York (276), Minnesota (121), Massachusetts (116), Idaho (80), and Utah (54), which likely contributed to the decreased growth rate of total plans at the national level. At the same time, an increase in the introduction of New Plans was observed in multiple smaller markets, including New Jersey (280% YoY growth), West Virginia (233%), Ohio (150%), Kentucky (125%), and Arkansas (117%).
1.3 MA/MAPD Overview
In contrast to previous years, the number of new plans introduced in 2023
increased at a higher rate, while the growth in total plans slowed.
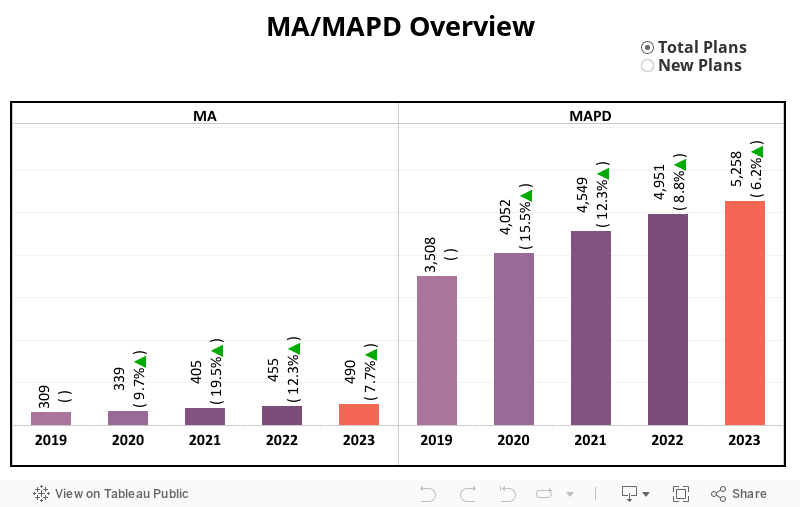
MAPD plans grew by 307, a 6% YoY increase, while MA Only plans increased by only 35. The absolute number of MAPD plan growth has decreased for the third year in a row (2020 saw a growth of 544 plans; 2021 added 497 plans, and 2022 increased by 402 plans), implying that the existing national market may be slowly reaching its saturation point.
Compared to the previous year, the number of New MAPD plans is up 8% in 2023 after slowing by 6% last year. There is a slight variation in the number of new Medicare Advantage plans, with only a net loss of a single plan.
2. SNP Type and Plan Type Overview
Over 77% of all plans available in the MA market are Non-Special Needs Plans (Non-SNP), followed by Dual Eligible Special Needs Plans (D-SNP) with 14%, Chronic Condition Special Needs Plans (C-SNP) with 5.6%, and Institutional Special Needs Plans (I-SNP) with 3.3%. Florida, as the largest Medicare Advantage market in the country, has the highest plans across all SNP categories, except for I-SNP, which belongs to New York.
Regarding plan type trends, HMO and PPO plan counts continue to rise while all other types, except for Regional PPOs, which have remained consistent, continue their decline in 2023.
MSA plans, which have grown in 2022, drop to their lowest mark in five years, with only 3 plans available. HMO and PPO together constitute ~96% of plans compared to other plan types, at 57.4% and 38.7% respectively. Surprisingly, Pennsylvania owns the highest number of available Local PPO plans while Florida, as anticipated, has the most HMOs and Regional PPOs.
2.1 SNP Type Overview
Non-SNP is the only category in 2023 to see an increase in New Plans introduced.
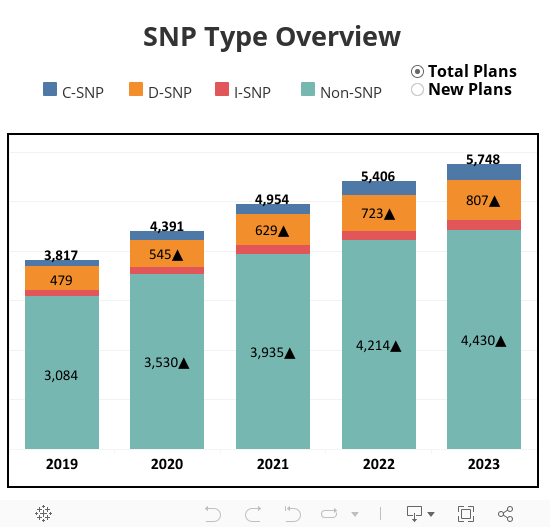
For the fourth consecutive year, there will be a net increase in total plans across all categories equaling 4,430 Non-SNP, 807 D-SNP, 320 C-SNP, and 191 I-SNP plans. The Non-SNP YoY net growth of only 5% is the lowest in six years, while C-SNP and D-SNP plans saw modest growth at 13.1% and 11.6% respectively.
Non-SNP plans are the only category to exhibit a rise in New Plans introduced in 2023 with 653, a growth of 14.4% over 2022, still short the 2021 total, which saw 685 plans added. D-SNP saw a slight decrease in the number of New Plans introduced from 140 (2022) to 135 (2023), a drop of 3.6%, while C-SNP decreased 12% YoY and I-SNP dropped 28.6% over 2022.
The ratio of New Plans to the total in the Non-SNP category rose slightly from 13.6% in 2022 to 14.7% in 2023, but still lags behind previous years.
2.2 Plan Type Overview (Non-SNP)
HMO Plans rebound after a historic drop in New Plans introduced in 2022, nearly tied with PPO.
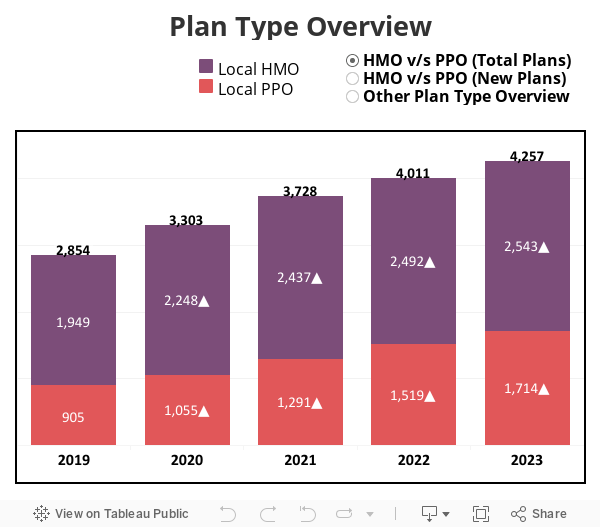
The growth of the PPO market has been exceptional as there will be 3X as many PPO plans in 2023 as there were in 2017. While the HMO segment grew by only 2% YoY, PPO has grown by an additional 12.8%, although this growth is the lowest recorded for that segment in the past 6 years.
A major shift from 2022, HMO regains some of its historical growth trajectories in 2023 by introducing 321 new plans, a 22.5% increase YoY. This comes after 2022 saw only 262 new HMO plans introduced, falling below PPO for the first time.
New PPO Plans, however, continued their trend growth at 9.6% from the previous year, adding 330 new plans, only nine more than HMO.
Through these various changes, 19.2% of all Non-SNP PPO plans are new in 2023, while new HMO accounts for 12.6% of the total. Despite this year’s resurgence in New Plans for HMO, PPO continues to grow at a faster rate and is still on pace to overtake HMO later this decade.
3. Premium and Cost Factors
The national average premium has decreased 2.5X since 2017, from $61 to $23 in 2023, with the primary cause being the continued growth of zero-premium plans. In 2023, approximately 66% of all Non-SNP plans will be zero-premium, up from less than 40% in 2017.
Over the same six-year period, the average deductible decreased by 18%, driven by the growth of the zero-deductible segment, which accounts for 66.8% of all Non-SNP MAPD plans, followed by the >$100 deductible segment, which accounts for 29.8% of the total. On the other hand, Maximum Out-of-Pocket (MOOP) has the most irregular pattern, equating to a 2% gain from 2017 to 2023, while there is a decrease in average MOOP this year compared to last. Approximately 86.4% of all Non-SNP plans have a MOOP greater than $3,000 in 2023.
3.1 Premium
The average Premium for Non-SNP plans has dropped 62% since 2017,
continuously forced lower by the growth of zero-premium plans.
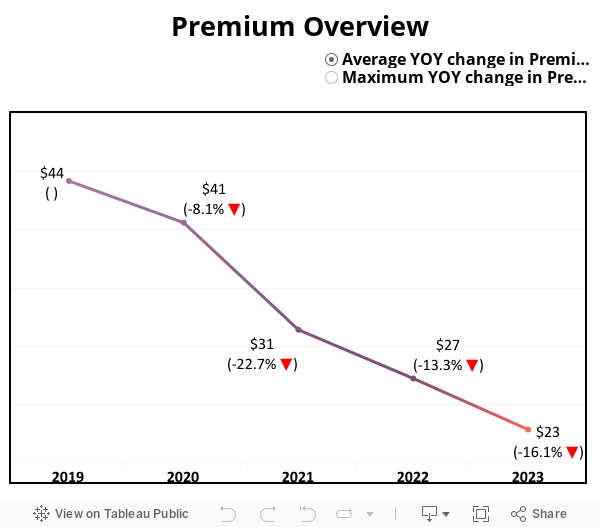
Driven by zero-premium plans, the average premium for Medicare Advantage Non-SNP plans falls to $23 in 2023, a 16% YoY decline after falling over 13% last year.
For the second consecutive year, the maximum premium value for Non-SNP plans also dropped; however, the change was minimal, from $302 to $301. This near-flat-line result follows a drop of ~14% from 2021 to 2022.
Average premiums are expected to continue their downward trajectory as more zero-premium plans are introduced and selected by consumers. Maximum premium values are much more inconsistent, with no anticipated change in value identified.
Zero-premium plan totals have tripled since 2017, overshadowing the
slow reduction of high-cost premium plans.
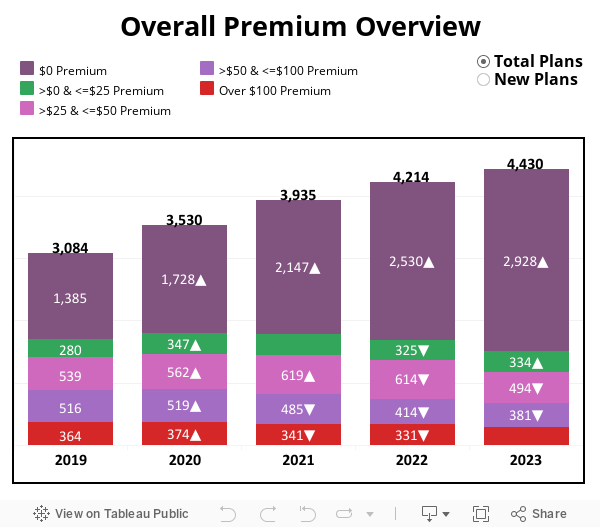
The significance of the zero-premium plan segment, and its impact on the Non-SNP market as a whole, is well documented. Demonstrating the significance of this segment is the growth in recent years, from 1,385 plans in 2019 to 2,928 in 2023, with a YoY net increase of 15.7%, down slightly from 2022 but still an increase in net.
Aside from the zero-premium plans, the only other premium group to experience growth is the >$0 to <=$25 premium segment, which increased its total plan count to 334, a 2.7% increase YoY, and the first increase by this segment following two years of decline.
All other segments recorded losses for the second consecutive year, which segments above $50 seeing losses for the third straight year. The greatest decrease belongs to the >$25 to <=$50 segment, down 19.5% YoY. This segment last saw growth in 2021 but has quickly regressed to pre-2019 counts.
After seeing fewer zero-premium New Plans in 2022, which was down 6% from 2021, the segment rebounded by releasing 526 New Plans in 2023, a 17.9% jump YoY.
Even with this slight variability YoY for zero-premium plans, this segment still dominates all other segments which combined for only 127 New Plans introduced, less than 20% of the total.
3.2 HMO and PPO Deep Dive
HMO plans only find growth in the zero-premium segment while
PPO also expands its <$25 premium segment.
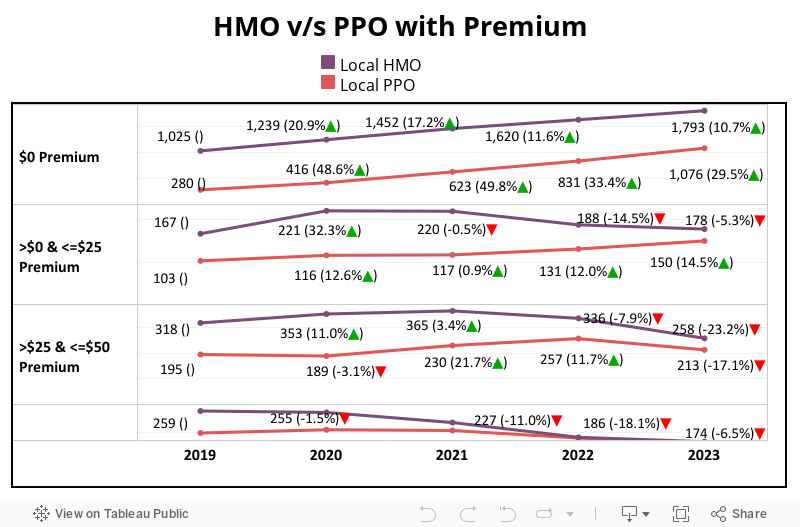
For the second consecutive year, the HMO plan segment continues to see a reduction in plan totals for all premium segments with exception of zero-premium plans. There were, however, some notable YoY changes for those premium segments.
Reduction in the >$0 to <=$25 segment slowed to -5.3%, an improvement from -14.5% in 2022, while the >$25 to <=$50 segment will drop by nearly one quarter.
PPO also witness some off-trend shifts in 2023, specifically their middle segment (>$25 to <=$50), which had a reduction in total plans for the first time in three years, while more expensive segments saw slight variations in their reduction.
Unlike HMO, however, PPO saw their two lowest cost segments, including zero-premium, continue to rise. The PPO zero-premium segment has now crossed 1,000 plans nationwide, a 29.5% jump YoY, while their >$0 to <=$25 segment added 19 plans, a YoY growth of 14.5%.
In 2023, following more expansion in the zero-premium market, approximately 70.5% of HMO plans will be zero-premium, while the ratio for PPO increases to 62.8%.
3.3 Zero Premium Expansion
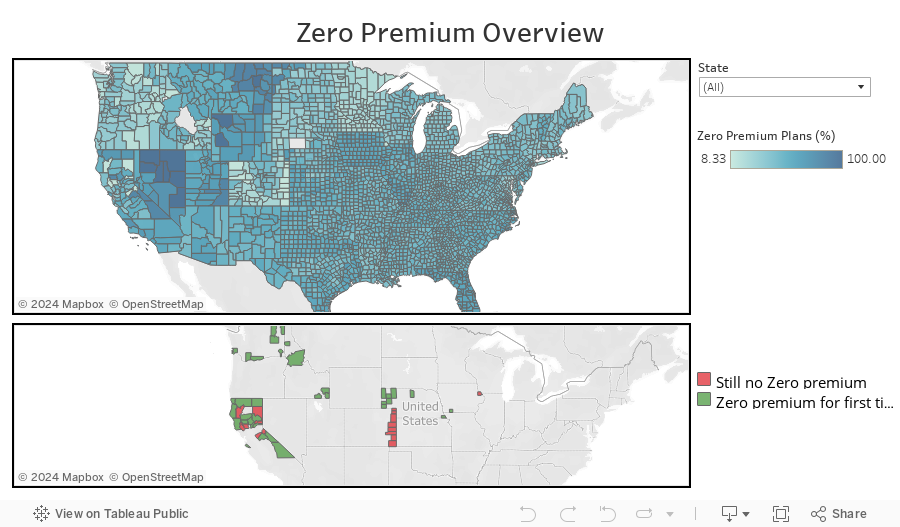
Following a multi-year proliferation of the zero-dollar premium segment, only 17 counties across the country will not offer one to consumers in 2023, down 36 counties from 2022.
Of the 36 counties across 5 states introducing a zero-premium plan for the first time in 2023, half will be in California, which is now tied with Colorado for having the most counties without a zero-premium option.
3.4 Drug Deductible
The average Drug Deductible plummets $18 in 2023 after falling
by only $9 total in the past five years.
The average Drug Deductible plummets $18 in 2023 after falling by only $9 total in the past five years.
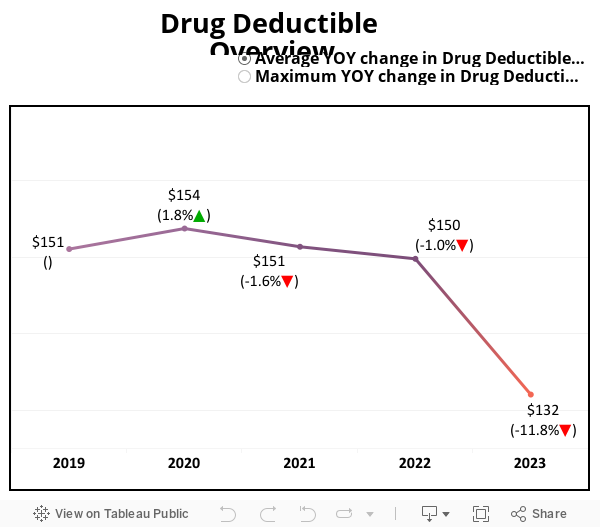
Following a five-year slow decline, which included a minor increase in 2020, the national average drug deductible declined nearly 12% in 2023 in a major shift.
Sitting at $161 in 2017, the average drug deductible had dropped only $9 to $150 through 2022, with the largest prior drop in that five-year period being only -5%. On trend, however, is the increase to the maximum drug deductible, which climbed up to $505, a 5% increase YoY.
With high YoY growth, the zero-deductible plan segment is
now 2X larger than all other segments combined.
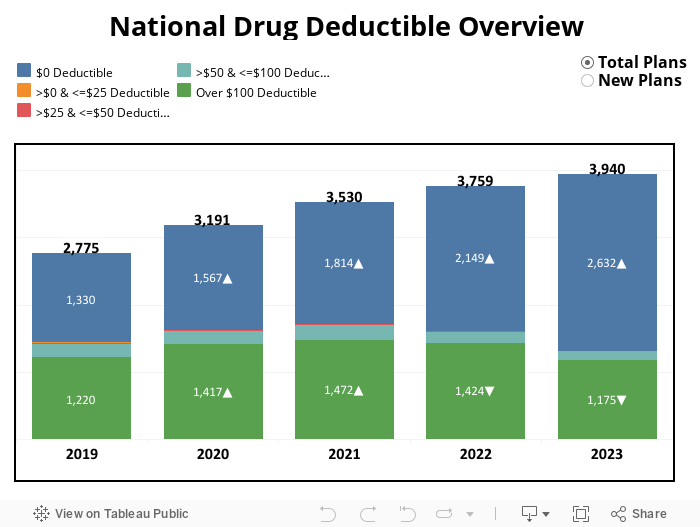
For the second consecutive year, zero-deductible plans continue to be the only segment experiencing actual growth. The >$0 and <=$25 deductible segment, which has not included an active plan since 2019, also saw a reintroduction with three plans moving into this segment for 2023.
One plan decreased from its 2022 deductible of $75, and the other two, both of which had been New Plans in 2021, dropped down from $200.
All other segments exhibit the opposite pattern, with a YoY reduction. High deductible plans over $100, which peaked in 2021 with 1,472 plans, have seen a 20% decline since that high-water mark.
The growth of the zero-deductible segment, 22.5% YoY, is driven heavily by a surge in New Plans, with 378 plans. A 32.6% increase over 2022 and the highest introduction of plans in this segment since 2020.
The high-deductibles segment, with all plans exceeding $100, saw a minor increase in New Plans to 203, down from 276 introduced in 2020.
3.5 In-Network Maximum Out-of-Pocket (MOOP)
The MOOP value increases to $8,300 in 2023 while the market average
drops for the second consecutive year.
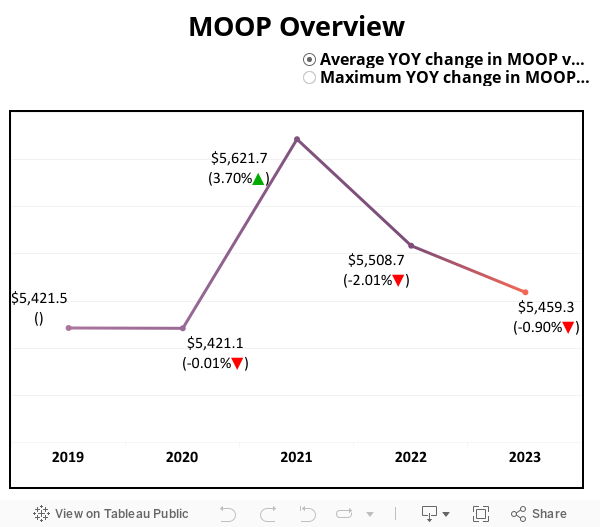
The average MOOP pattern over the past six years has been erratic, though the overall change has been minimal. The national average MOOP lands at $5,459 in 2023, a reduction of just under 1% YoY. This follows a 3.7% increase in 2021, which saw a high of $5,621, and a 2% decrease in 2022.
All In-Network (INN) MOOP Segments grow, with the
$1,500 to $3,000 segment increasing by 30%.
All In-Network (INN) MOOP Segments grow, with the $1,500 to $3,000 segment increasing by 30%.
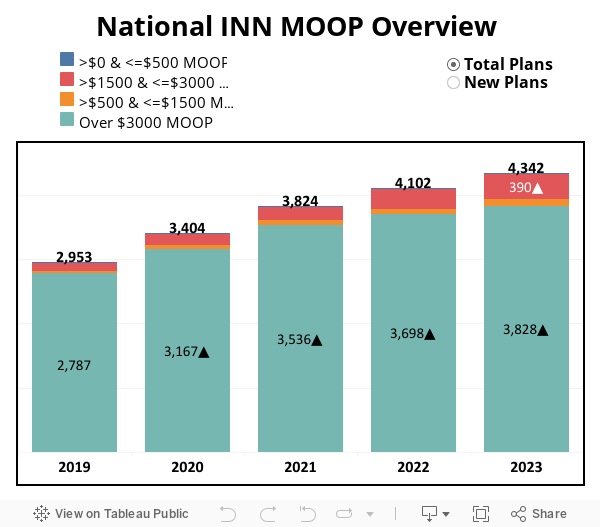
Plan totals increase across all MOOP segments in 2023, with the highest growth found in those plans with a MOOP of over $1,500. The market’s highest segment plans, with a MOOP of >$3,000, had a modest net growth of 3.5% YoY, while the next lower segment, plans with a MOOP >$1,500 to <=$3,000, grew by 30%. After seeing 40% growth in 2022 as well, the second largest segment now includes 390 plans, 8.8% of the total.
Unlike the positive net growth trend across MOOP segments, the New Plan counts for each segment had more YoY variability in 2023. The >$3,000 segment introduced 587 New Plans, up 19% from last year but still below the high of 630 in 2021, while the remaining segments had little variation.
4. Benefit Overview
Payors continue to drive consumer value in 2023 by consistently increasing Supplemental Benefit coverage, with new benefits rising in popularity each year. Comprehensive Dental and Over-the-Counter (OTC) saw the largest gains, while Transportation and Meals continue to grow in popularity.
At the same time, several Enhanced Benefits saw a decline in 2023 compared to previous years, with the largest drop by Counseling Services. Personal Emergency Response Systems (PERS) had the largest gain of any Enhanced Benefit for 2023 after modest gains in previous years.
4.1 Supplemental Benefit Overview
OTC benefits have increased in offering by 31.9% since 2019 while PERS grew by 11.9% YoY.
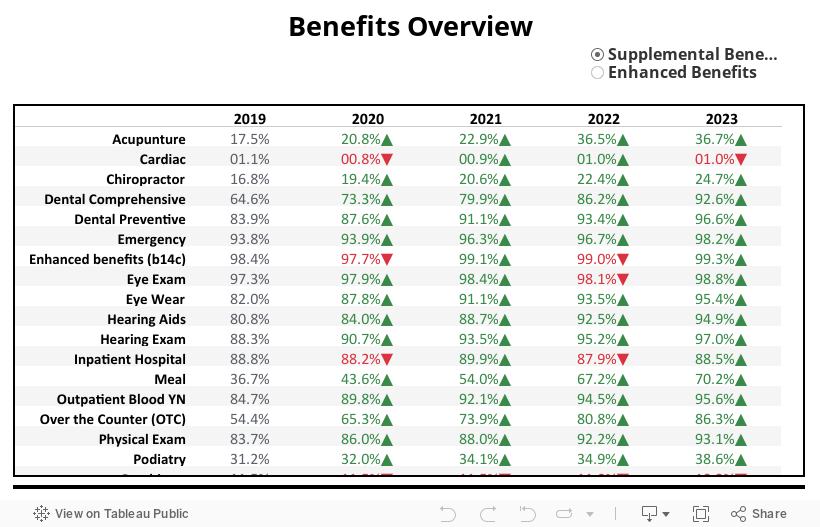
The inclusion of Supplemental Benefits in Medicare Advantage plans continues to rise in 2023, soon reaching near-complete saturation for multiple benefits. Ten various benefits are now included in over 90% of MA plans after Comprehensive Dental grew from 86.2% to 92.6% YoY.
Only three benefits saw a reduction in coverage for 2023, with Psychiatry, which dropped only 0.8%, being the most prominent benefit, now offered in 10.2% of plans. OTC, which was included in only 54.4% of plans back in 2019, will be offered in more than 86% of plans next year, likely to break 90% in 2024.
Meal benefits, which have also seen consistent growth in offerings, have increased inclusion by 33.5% over four years, available in 70.2% of plans in 2023.
4.2 Enhanced Benefit Overview
Unlike Supplemental Benefits, Enhanced Benefits generally see a lower offering ratio, aside from a couple of key benefits. Fitness continues to be highly offered, increasing YoY slightly to 97.9% inclusion among Non-SNP plans.
Remote Access Technologies, the second most offered Enhanced Benefit, also recorded slight growth, now offered in 75.5% of plans but still down from the highest inclusion ratio of 87.7% in 2019.
All other benefits fall below 40% inclusion, with Health Education the next highest at 36.8%. PERS, currently sitting just under 30%, has seen a major jump from 18% to 29.9% YoY, the largest YoY gain for any Enhanced Benefit, followed by In-Home Support Services, up from 3.3% in 2020 to 19.5% in 2023.
Medical Nutrition Therapy (MNT), Enhanced Disease Management, and Counseling Services each saw a noticeable decline in offerings, with the latter falling from 11.9% in 2022 to 3.4% in 2023.
Conclusion
Each year, as the Medicare Advantage market widens, so does the number of options for consumers. The market will see average plans per county climb to 64, up ~18% YoY. Each of these additions brings more choices and confusion, as the mix of benefits, costs, and other plan factors increases.
The impact of that growth will be most visible in January, following the release of the first 2023 Meidcare Advantage Enrollment Report from CMS. We’ll also see how the continued expansion of zero-premium, low-deductible, high MOOP PPO plans will shift membership trends, setting up the Plan Type and benefits combinations that each Payor has already begun contemplating for 2024 & beyond.