
Creating the ideal balance of design and cost features of insurance plans is challenging for any organization, given the vast diversity of Medicare Advantage (MA) options created to serve the beneficiaries with the best affordable coverage.
Enrollment in the Individual Medicare Advantage market climbed from 23.9 million in February 2022 to 25.6 million in February 2023, a 7.1% increase lower than in any preceding year.
The 2023 Annual Enrollment Period (AEP) witnessed a total growth of 338 net plans against 452 plans last year, or a 6.3% increase smaller than the 9.1% increase reported in the previous AEP, indicating the slower growth rate in the introduction of plans.
In addition to highlighting the enrollment changes in plan type and pricing categories, this study was designed to demonstrate how the Medicare Advantage market has transformed over the last five years.
1. General Overview
The MA market grew year-over-year (YoY) with 5,744 total plans available in 2023, with net growth at a moderate rate. Overall enrollments grew by 43.8% from 2019, with 17.8 million reached to 25.6 million in the current year; however, witnessing a decline in net enrollment from the previous year.
The absolute net enrollment contribution was higher in New Plans, and Renewal Plans with service area expansion (SAE) at a national level. Even though California had topped in overall enrollment, it saw a major decline in net growth this year.
Group plans saw a one million increase in enrollment from 2019 (4.4 million) to 2023 (5.4 million) and grew from 0.12 million net enrollment or AEP net enrollment (February 2023 – December 2022) in 2022 to 0.26 million this year.
Renewal Plans and Renewal Plans with SAE account for the vast bulk of the plans in both MA Only and MAPD, with a combined share of above 75%, but the net gain was noticed in New Plans and Renewal Plans with SAE.
Enrollment in MA Only plans reached 0.8 million and MAPD by 24.8 million, while the net enrollment declined and accounted for 0.06 million (MA Only) and 0.78 million (MAPD).
Note: The absolute net enrollment contribution percentage (or net enrollment contribution) is calculated by dividing the absolute net enrollment for February 2023 to December 2022 by the total absolute net enrollment for all plan descriptions [includes New Plans, Initial Contracts, Renewal Plans, Consolidated Renewal Plans, Renewal Plans with SAE and Renewal Plans with SAR (service area reduction)].
1.1 National Overview
Although the market is seeing more plans introduced, the expansion of net plans is slower.
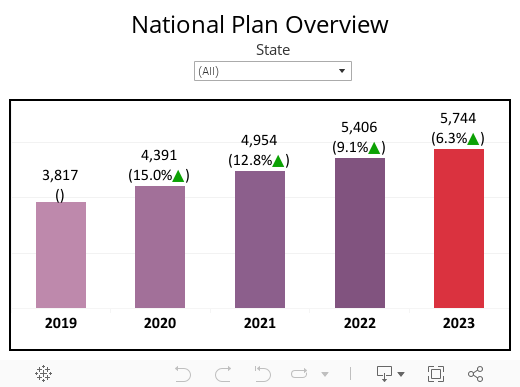
The total number of plans in the MA market accounts for 5,744 in 2023, with 6.3% YoY growth. The net growth of plans in 2023 is smaller than in recent years and 25% less than in 2022.
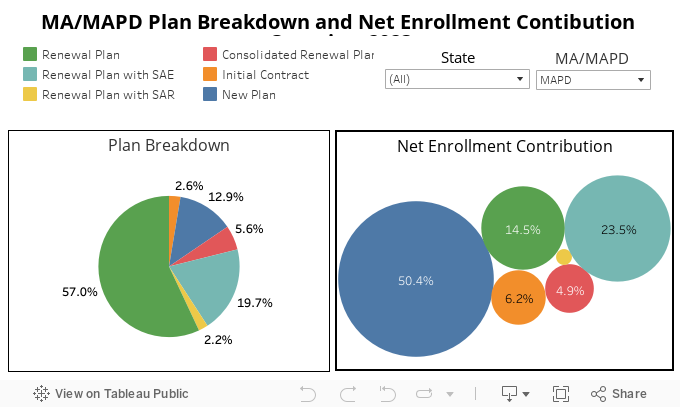
According to the absolute net enrollment contribution, about half the plans come from New Plans.
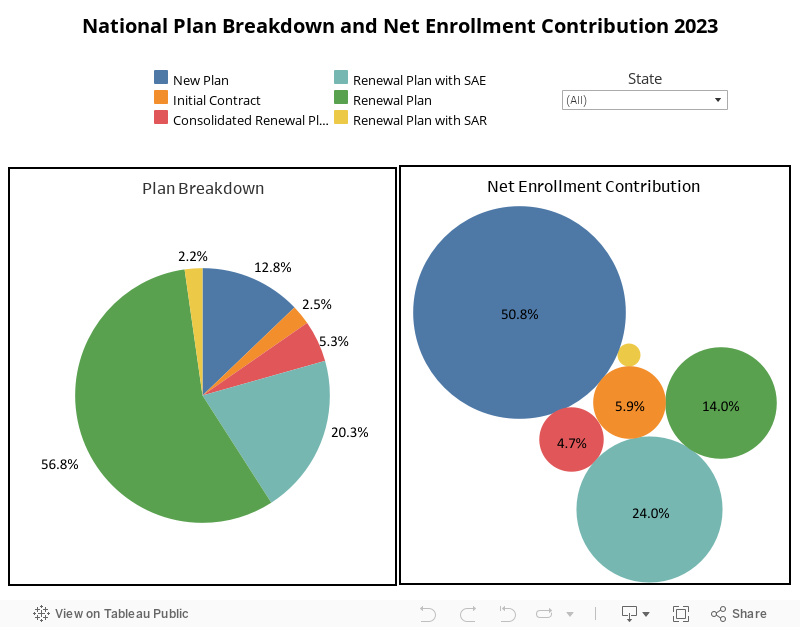
About 881 plans, including New Plans and Initial Contracts, contribute 15.3%, while the remaining percentage is for Renewal Plans.
The breakdown observed an increase in Renewal Plans with SAE (18% in 2022 to 20.3% in 2023) and Consolidated Renewal Plans (3.5% in 2022 to 5.3% in 2023) compared to last year.
The percentage share of Renewal Plans (56.8%) is higher than any other plans, but contrary to this, the absolute net enrollment contribution saw a loss which was also higher in this category with 14%, followed by Renewal Plans with SAR. However, New Plans comprise most of the net enrollment contribution (50.8%).
Net growth in membership saw a decline since 2022, with a reduction of 30.5%.
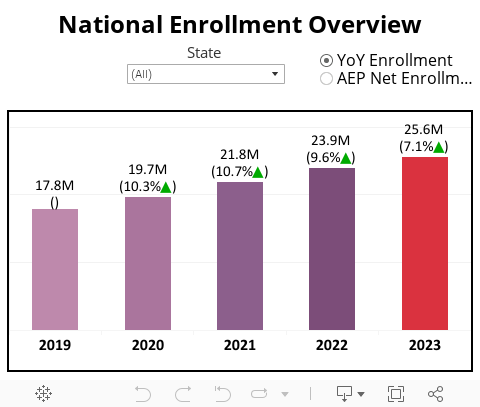
At a pace of 7.1% YoY, the number of people enrolled in the Medicare Advantage market had reached 25.6 million by the end of February 2023. In contrast to the 2020 spike in net enrollment, it had a dip from 2022 with an 8% decline, and additionally, this year experienced a 30.5% decrease from the previous year with 0.84 million.
California bags for both the lowest net enrollment and the largest overall enrollment of total plans.
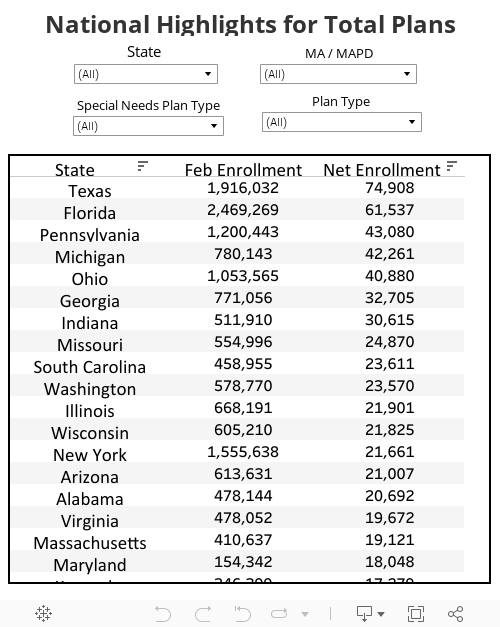
With a total enrollment of 2.54 million, 2.47 million, 1.92 million, 1.56 million, and 1.20 million, respectively, in 2023, California, Florida, Texas, New York, and Pennsylvania have been the leading top five States in the MA market since 2019. Nonetheless, Texas, Florida, Pennsylvania, Michigan, and Ohio witnessed the sharpest net growth.
Wyoming had marked its growth rate as the highest this year in terms of both total enrollment (104%) and net enrollment (112%), while negative growth was seen in Washington D.C and Connecticut.
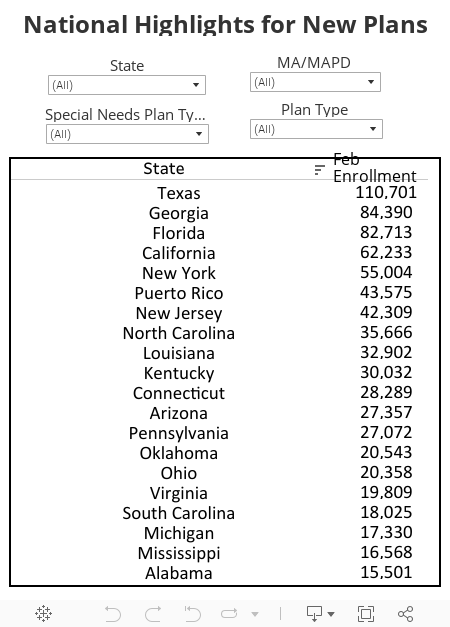
Texas had the maximum number of new plan enrollees, 0.11 million, followed by Georgia and Florida. The growth rate was higher in New Jersey, West Virginia, and Georgia.
1.2 Individual v/s Group Plans Overview
Group plans noticed a rise in net enrollment and a moderate rise in aggregate enrollment.
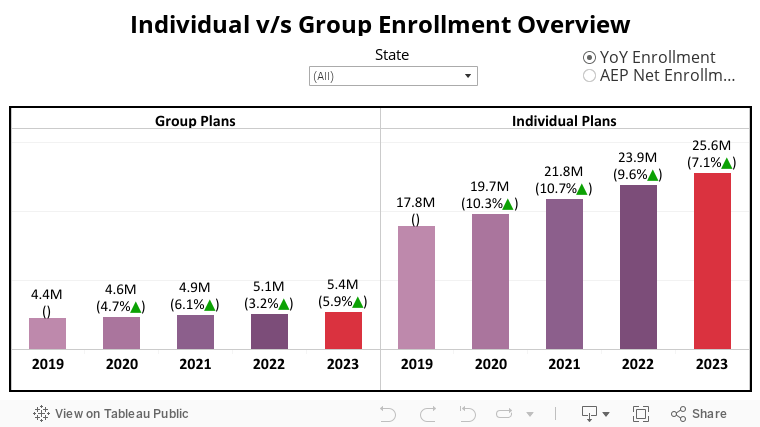
The Group plans enrollment showed a slight growth with a 5.9% YoY increase. Even the net enrollment of 0.26 million noticed the gain, the second highest among other years after 0.29 million in 2019.
For quite a while, the group plan pattern in net enrollment indicates a rise in one year and a fall in the following year, suggesting that if the trend holds true, the group plan may decline the next year.
1.3 MA Only v/s MAPD Overview
The YoY growth rate for introducing MA Only plans is higher than MAPD from 2021.
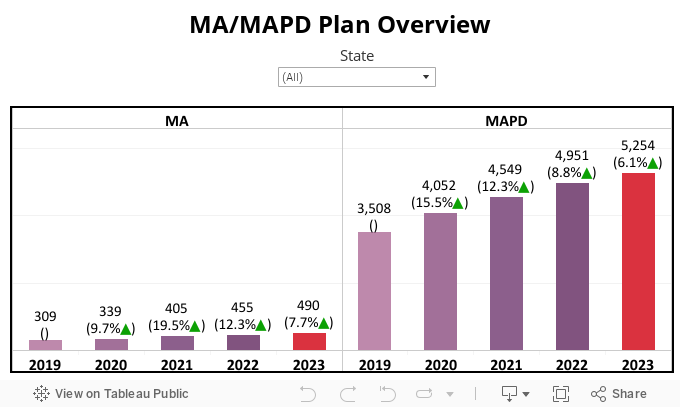
The number of MAPD plans is higher than Medicare Advantage Only plans which increased by 303, whereas MA Only plans grew by 35 plans.
The absolute number of MAPD plan growth has fallen since 2020 (2020 witnessed a growth of 544 plans; 2021 added 497 plans; and 2022 increased by 402 plans) indicating that the national market may be gradually approaching saturation.
More than three-fourths of the MA Only and MAPD plans come from Renewal Plans and Renewal Plans with SAE.
Out of all plans, New Plans and Initial Contracts together represent 13.6% in MA Only and 15.5% in MAPD. The net enrollment gain was split between New Plans (59.3%) and Renewal Plans with SAE (34.3%) at a higher rate, combining to get over 93.6%, while the rest of the Renewal Plans, apart from Renewal Plans with SAE, noticed a net membership decrease in MA Only.
In line with last year, MAPD plans recorded a net enrollment loss in Renewal Plans and Renewal Plans with SAR nearly to 15%, while the combined increase of New Plans and Renewal Plans with SAE sums up to 73.9%.
MA Only enrollment is showing marginal growth, while the MAPD net enrollment is declining.
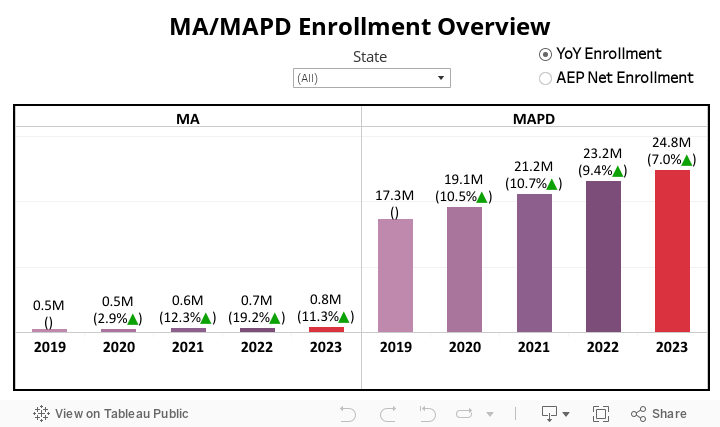
Medicre Advantage Only plans have managed to increase by 11.3% this year. MAPD has added 1.6 million enrollees to the market, accounting for 24.8 million with only 7% YoY growth which is noticed as lesser than any year.
For the first time, the net enrollment of MA Only plans dropped to 0.06 million since 2020, while MAPD started to fall for the second consecutive year to the lowest of 0.78 million with a 30% YoY decrease.
California and Florida are in the top position for MAPD plans with total enrollment, while for MA Only Plans, it is Wisconsin and Minnesota. Texas has managed to crown the third position in overall enrollment for both MA Only and MAPD plans, while it bags first place in terms of net enrollment. Even for the new plans, Texas is the leading State with current enrollment.
2. Plan Type Overview
The growth in the number of total plans YoY is highest in Dual Eligible Special Needs Plans (D-SNP) and Chronic Condition Special Needs Plans (C-SNP), among others. Renewal Plans constituted the negative share of net enrollment in all Special Needs Plan (SNP) types with a greater share in plan breakdown, while Renewal Plans with SAR were in loss, as expected, except for D-SNP.
Though all SNP types witnessed growth, C-SNP continues to grow at the second fastest rate, with a growth rate of 13.8%. Net enrollment in Non-Special Needs Plans (Non-SNP) and Institutional Special Needs Plans (I-SNP) declined while it increased for D-SNP and C-SNP plans.
PPOs rising at a higher rate than HMOs is a well-known fact substantiated by the net enrollment contribution from New Plans higher too and supported by enrollment growth. All the plan types are in decreasing pattern in terms of net enrollment.
2.1 SNP Type overview
The number of plans for D-SNP is growing but Non-SNP growth has become moderate.
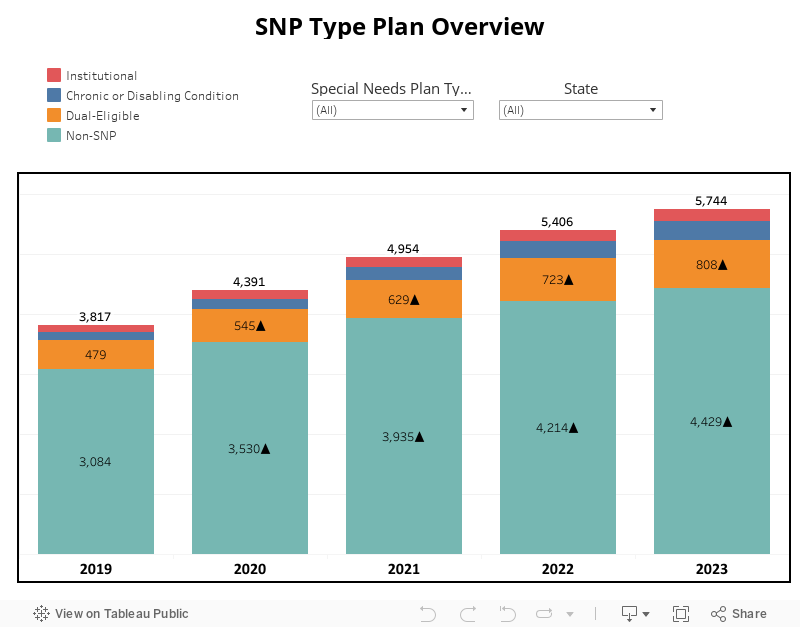
All SNP categories witnessed a positive trend in 2023. The demand for D-SNP plans has not come down (11.8% YoY), but the demand for all the other types of SNP has come down slightly, especially for I-SNP, which has increased by only 2.7% YoY. Non-SNP has seen a stable demand, increased by 5.1%, and C-SNP has 11.7% YoY growth.
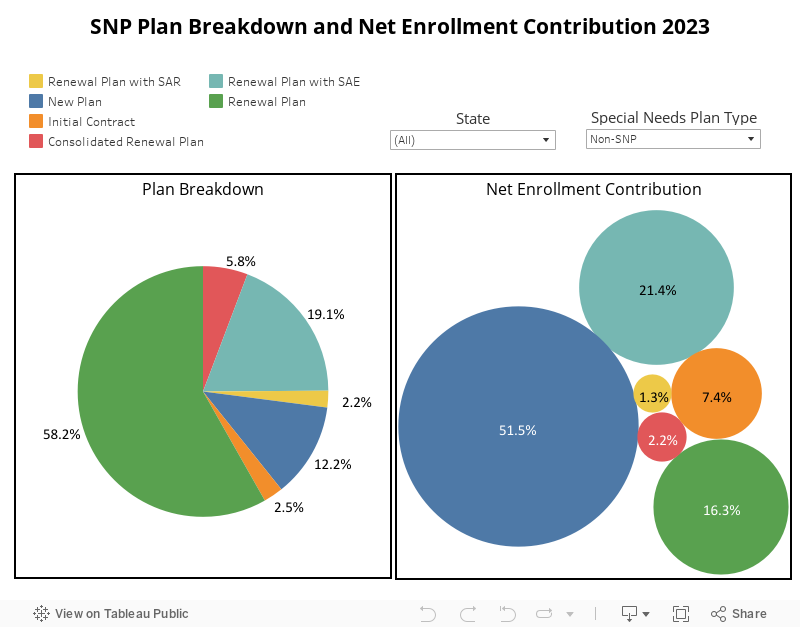
Almost 59% of net enrollment in Non-SNP is from New Plans and Initial Contracts.
In all the SNP categories, Renewal Plans had a greater share compared to other plans ranging from 49% to 60%. C-SNP has the highest percentage of new plans (23%) and Renewal Plans (60.4%) in 2023, among other SNP types.
The net enrollment contribution was higher in New Plans from all the SNP types except I-SNP, which has a higher gain from Renewal Plans with SAE. Consolidated Renewal Plans saw a loss in net enrollment only in I-SNP.
C-SNP enrollment grew by 13.8% in 2023 from 4.7% in 2022.
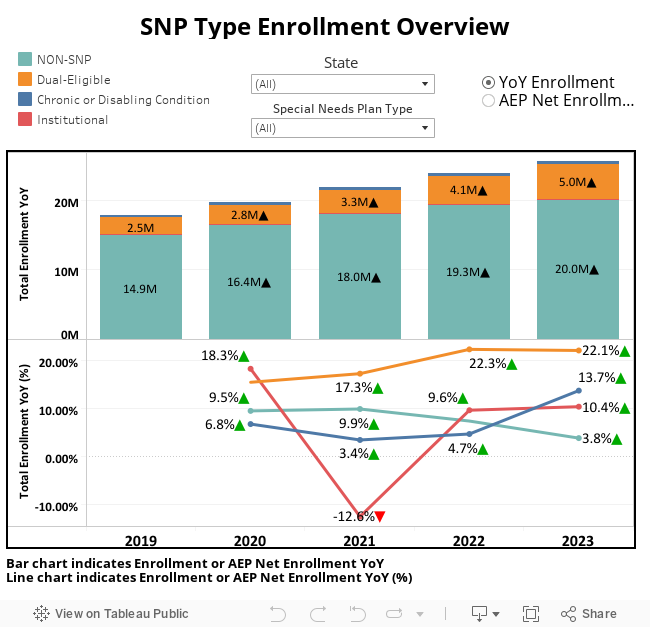
I-SNP remains stagnant with 0.1 million, while the Non-SNP added 0.7 million to reach 20 million in 2023 with 3.8% YoY which is lesser than in 2022 (7.4%). D-SNP showed a noticeable rise of 5 million in total, with 22.1% YoY growth (23.5% in 2022).
Surprisingly, C-SNP spiked from 4.7% to 13.8% this year, accounting for 0.5 million. Net enrollment in the Non-SNP has declined to 54% YoY and I-SNP by 74% YoY. However, the gain in net enrollment was observed in D-SNP by 21% and C-SNP by 509% YoY.
California, Texas, and Florida are the top three states having higher enrollment for the Non-SNP and C-SNP. New York and Florida have higher enrollment for D-SNP and I-SNP plans. Texas has higher net enrollment for Non-SNP and I-SNP, California for D-SNP, and Florida for C-SNP.
2.2 Plan Type Overview (Non-SNP)
The number of plans in HMO has almost plateaued but PPO has great demand.
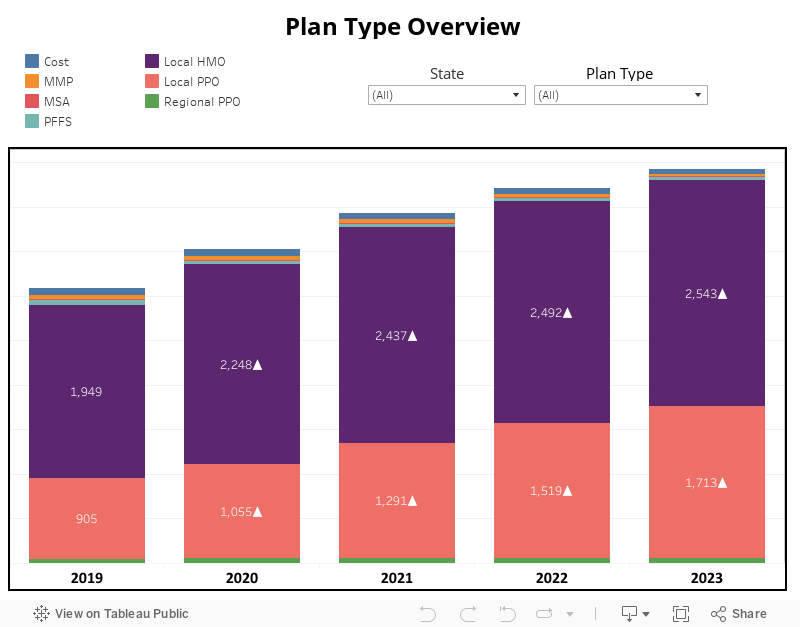
Only HMOs and PPOs saw a positive increase in the number of total plans, with a 2% and 13% YoY rise, respectively. Regional PPO remains unchanged, but all the others saw a decrease which has been seen over the years.
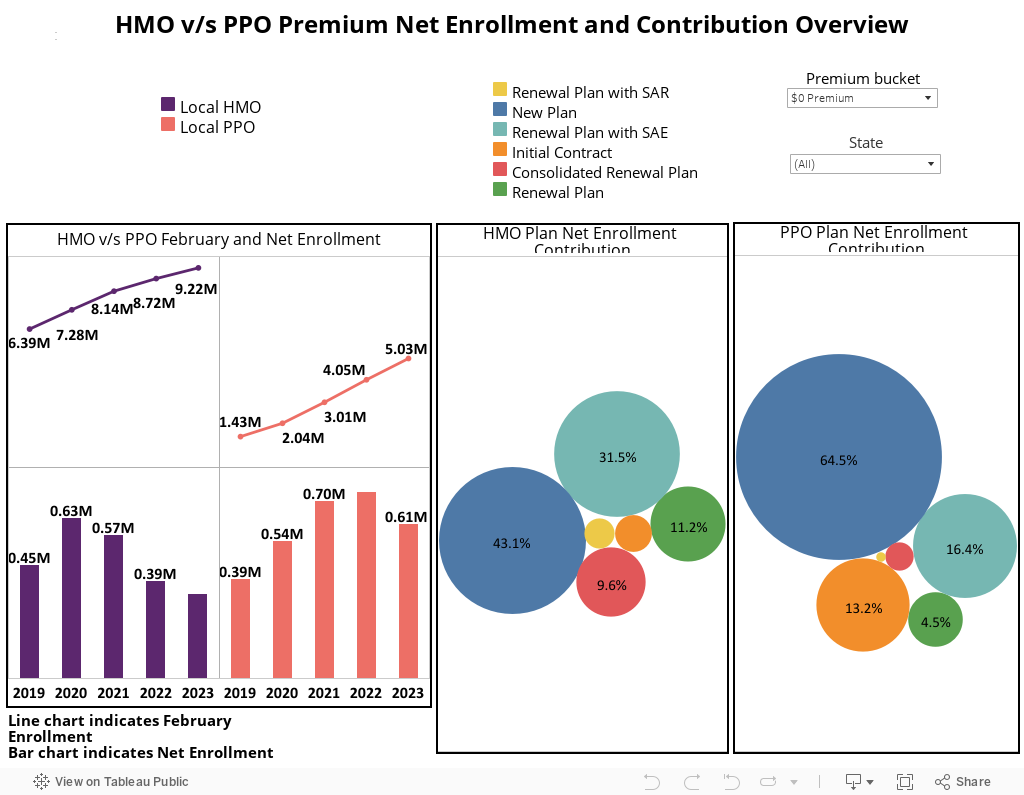
Percentage share and net enrollment contribution in New Plans for PPO are higher than HMO, indicating its growth in the MA market.
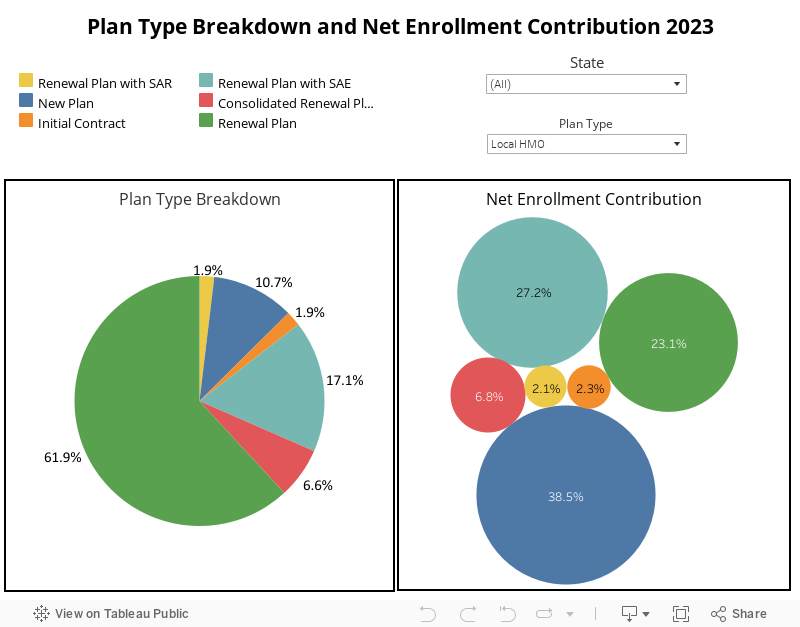
Apart from the Medical Savings Account (MSA), which has a share of only 33% in Renewal Plans, however, in other plan types, it ranges from 50% to 98%. HMOs and PPOs have New Plans and Initial Contracts together of 12.6% and 19.3%, respectively. Medicare-Medicaid Plan (MMP), MSA, and Private Fee-For-Service (PFFS) are composed of renewal plans only.
Net enrollment contributed more from new plans in HMO (40.8%) and PPO (79.3%). Altogether 2.2% loss in net enrollment was noticed in PPO and 25.2% in HMO, which was contributed by renewal plans. Cost, PFFS, Regional PPO, and MMP plans have a higher loss in net enrollment contribution.
Enrollment in PPO increased by 14%, but HMO remained constant, while the net enrollment decreased in all plan types.
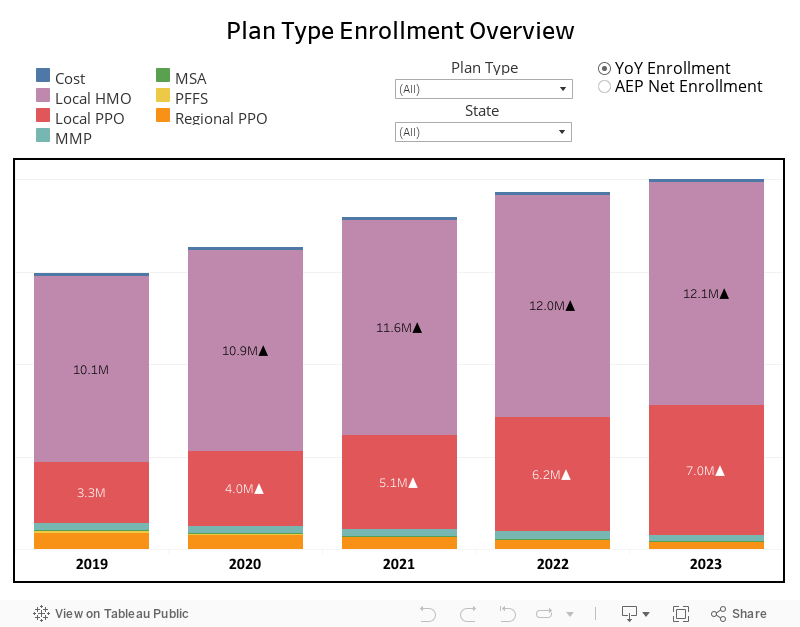
HMO has increased by only 0.8%, reaching 12.1 million enrollments, while PPO rose by 14.4%, which is still much less than the 21% growth witnessed over the previous year. However, all the other plan types noticed a declining trend. The net enrollment of HMOs has dropped drastically to 89%, and even PPOs noticed a 22% reduction.
California and Florida have the highest enrollment in HMO and PPO, respectively, while Ohio and New York bagged the top spot in net enrollment for the same.
3. Premium and Cost factors
Note: Only Non-SNP plans are considered under SNP type with all the plan types.
Zero-Premium Plans dominate the Medicare Advantage market, with 91% of net enrollment gain in total plans greater than the previous year (86.9%). Renewal Plans occupy a larger share in plan breakdown under all the premium segments in HMO and PPO.
While it is true that net enrollment contribution for zero-premium plans is higher this year compared to non-zero-premium segments in HMO and PPO, actual net enrollment is lower and decreasing from the previous year.
PPOs have a sizeable positive net enrollment contribution for New Plans and have shown a small share only in the >$100 segment. Just like premiums, even in the drug deductible, which is also an important cost factor, saw that the zero-drug segment dominates in the market with higher plan share and net gain contribution; there are 99 enrollments per plan for the zero-premium segment and 87 enrollments per plan for the zero-drug deductible segment.
Along with these factors, Part B giveback also impacted the market by doubling plans since 2021 with the Part B giveback benefit and noticed an upward pattern in the enrollment and net enrollment among Part B giveback plans YoY.
3.1 Premium Overview
Though the plan's share is 66% of the total plans, the gain was 91%. However, the share in New Plans accounts for 80.6%; the net gain reaches 88%.
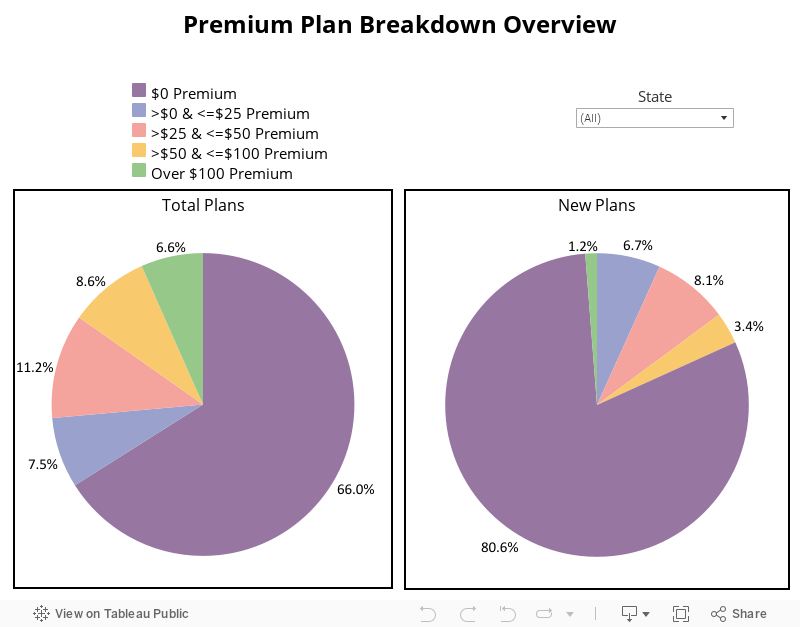
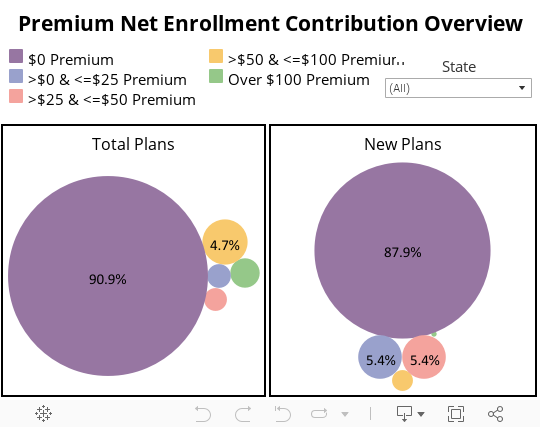
Zero-premium plans stand out evidently in both total plans and New Plans with tremendous share under the plan breakdown and with net enrollment criteria.
Unlike the previous year among non-zero-premium, only the >$0 to <= $25 segment noticed a positive contribution towards the net enrollment, but the remaining segments followed the loss in total plans. In contradiction to the total plans, the net enrollment gain was seen in all segments of the premium in New Plans.
Despite an increase in enrollments under zero-premium segments, net enrollments are away back from last year.
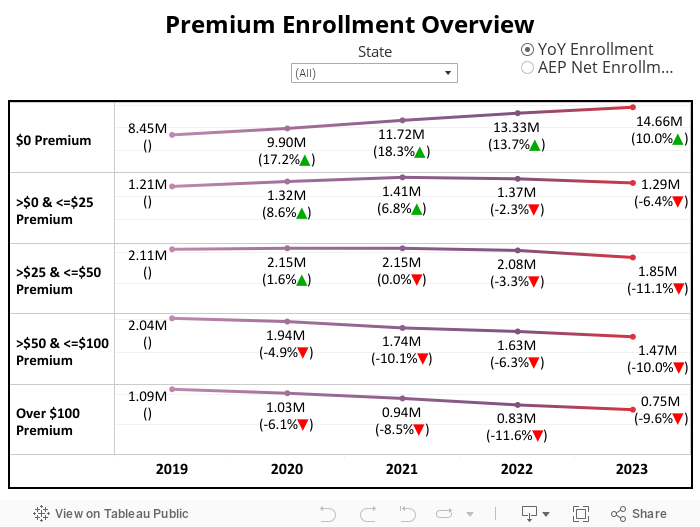
Since 2021 almost all non-zero-premium segments are showing a declining trend, and in reverse order, zero-premium plans grew YoY by 7.8%, which includes 73% of total Non-SNP enrollments. Surprisingly, the net enrollment of zero-premium has been reduced from 2022 by 16.8%, and other segments are picking up the trend.
As the premium increases, the average enrollment per plan decreases for new plans.
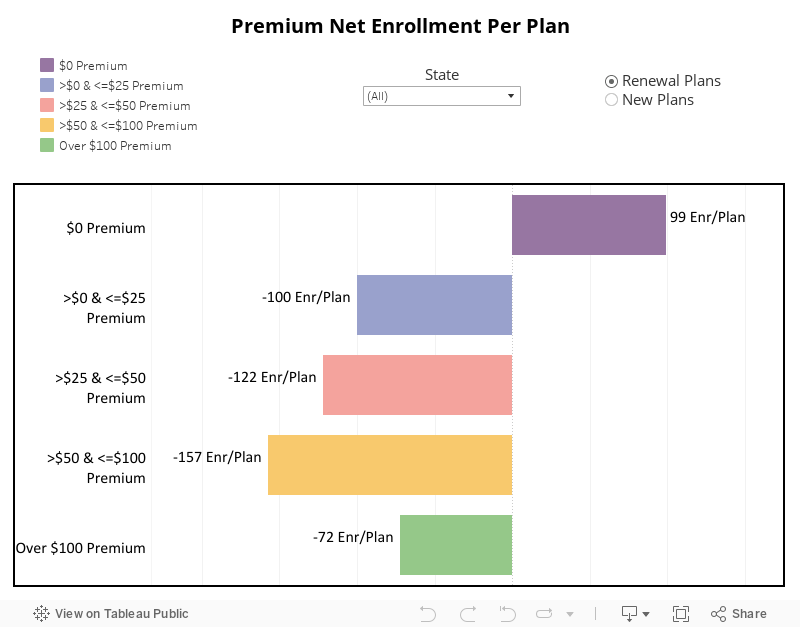
Zero-premium plans gained an average of 99 enrollments per plan for all renewal plans, while >$50 to <=$100 premium plans lost an average of 157.
Looking at the new plans, under the non-zero-premium category, that is >$0 to <=$25 segment beats others except zero-premium, which has 1,296 enrollments per plan.
3.2 HMO v/s PPO Deep Dive
In every premium segment, the share of New Plans is greater in PPO than in HMO, evidently indicating proof of its growth.
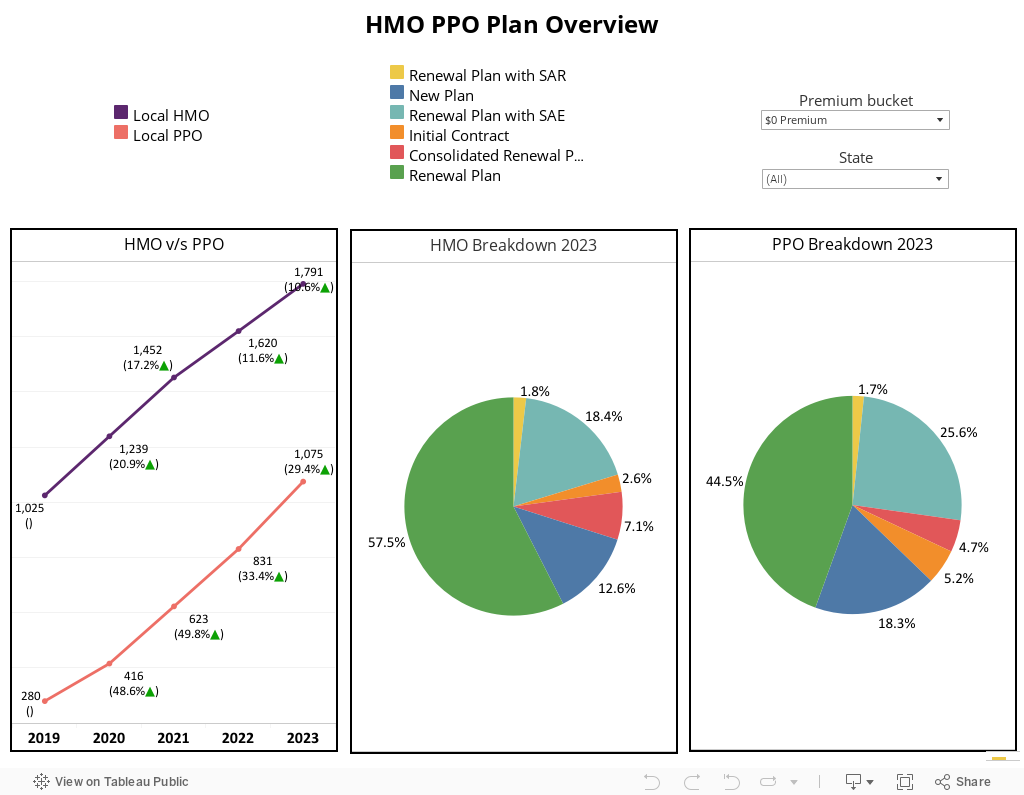
The number of Medicare Advantage plans in HMO increased only in the zero-premium segment; otherwise, all segments lost growth, whereas plans in PPO grew up to $25 premium. The combined percentage of New Plans and Initial Contracts is greater in zero-premium plans both in HMO (~15%) and PPO (23.5%).
Renewal Plans were highest in the >$100 premium segment with HMOs of about 90.7% and PPO of 79.2%, followed by Renewal Plans with SAE to mark their scope of growth under the >$0 to <=$25 segment in HMO with the highest of 24.7% against other segments, while in PPO it has a greater contribution in >$25 to <=$50 segment with almost 24%. In >$0 to <=$25 premium segment in HMO and PPO, as well as in >$100 (only in HMO), has no Initial Contracts.
Except for the segment comprising PPO plans with premiums greater than $100, the net enrollment contribution percentage increased in the remaining segments.
Only the zero-premium segment of HMOs is currently seeing growth in current enrollment, whereas PPO enrollments rise until $25 premium plans and then fall, following a pattern identical to the trend of plan numbers outlined above.
In terms of net enrollment, all the segments noticed a decline or negative numbers except for the >$0 to <=$25 and >$50 to <=$100 premium segments, both in HMO and PPO plans.
HMO Renewal Plans have contributed towards the loss of net enrollment, which had a greater share of plan breakdown in all segments of the premium except for zero-premium, in which new plans had a larger share of 45.8%.
PPO has positive net enrollment across all plans in the zero-premium segment, but in the >$0 to <=$25 segment, all the renewal plans contributed towards net loss except for Renewal Plans with SAE and New Plans share having a combined gain of 72.2%. Under the >$100 segment, only Renewal Plans with SAE had gained in net enrollment contribution in HMO; however, for PPO Renewal Plans with SAE and New Plans had growth towards net enrollment.
3.3 Drug Deductibles Overview
The zero-drug deductible plan continues to be with the highest share.
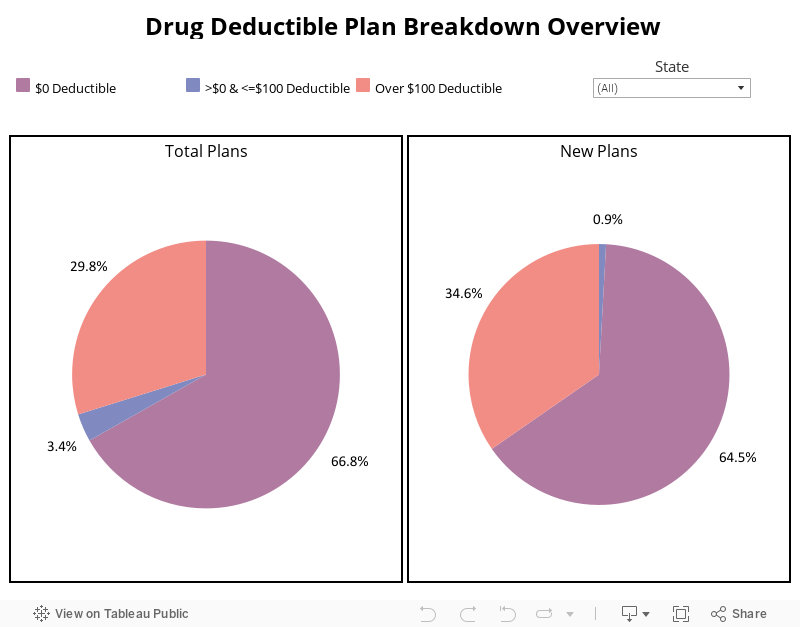
The zero-drug segment looks prominent among the drug deductibles as >65% in total plans and New Plans compared to the non-zero segment of drug deductibles. The market is split between zero-drugs and >$100 segments of deductible with a very low preference for the >$0 to < = $100 segment.
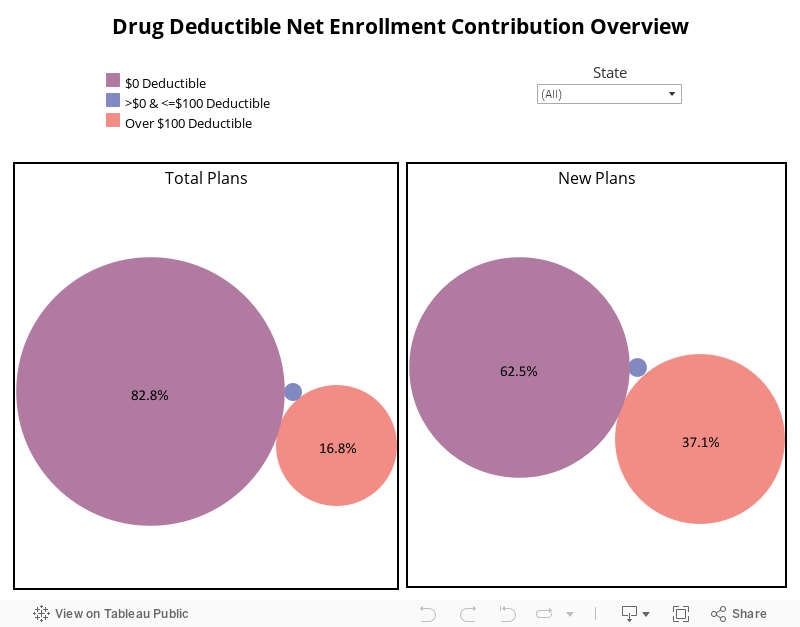
For the net enrollment contribution, the zero-drug segment is the clear winner at about 83% in total plans and 63% in New Plans, and in all the segments, the contribution is positive.
Enrollment and net enrollment increased only in the zero-drug deductible segment and decreased in other segments..
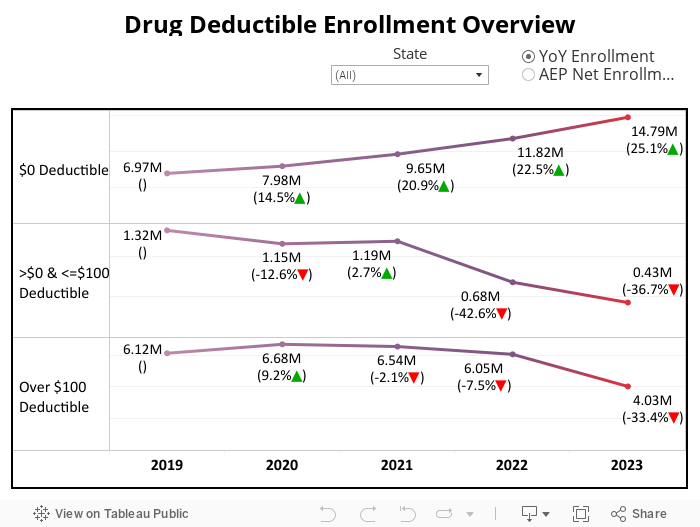
Enrollment in the zero-drug deductible segment accounts for 14.8 million with 25% YoY growth, while the >$100 drug deductible segment has 4.03 million enrollees less than the previous year (6.05 million).
From the last year, the net enrollment in all the drug deductible segments is decreasing except for the zero-drug deductible segment, and a higher rate of reduction is observed in the >$0 to <=$100 drug deductible segment.
Only the zero-drug deductible segment has positive net enrollment per plan in renewal plans.
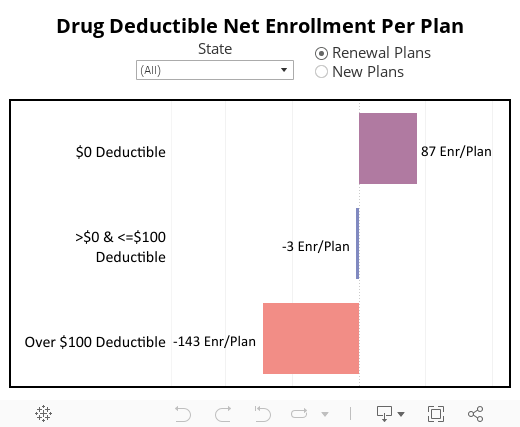
With about 87 enrollments per plan, a zero-drug deductible segment is the most preferred option for enrollees among renewal plans. The new plans have >1,200 enrollment per plan in zero-drug deductible and >$100 drug deductible segments.
3.4 Part B giveback
Out of total Non-SNP plans 14.6% have part B giveback benefit.
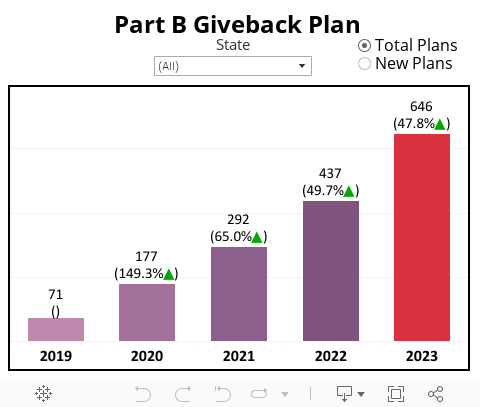
Part B giveback plans account for about 646 total plans that have giveback associated with them. As seen from the graph above, the popularity has been increasing YoY, with about a 47.8% increase in 2023. Presently 202 New Plans also have the Part B giveback, which is 31% out of new Non-SNP plans.
The contribution towards the net enrollment is positive, accounting for 90.2%.
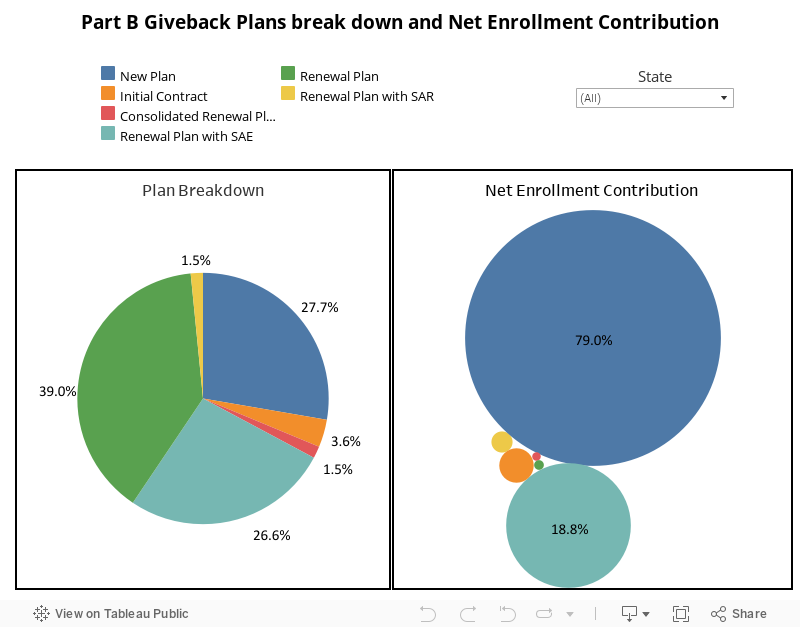
Combining Renewal Plans and Renewal Plans with SAE accounts for 65.6% of plans with Part B Giveback and has New Plans and Initial Contracts for about 31.3%.
The New Plans have the highest contribution towards net enrollment, followed by Renewal Plans with SAE indicating the importance of Part B giveback.
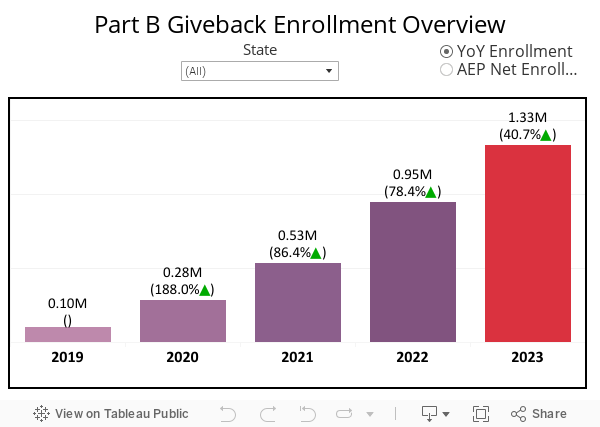
Part B giveback plans enrollment noticed a tremendous spike in 2020 and later saw a moderate rise in 2023, accounting for more than 1.33 million, which was 0.10 million in 2019. The highest net enrollment was seen in 2021 with 63% of YoY growth, continued the trend by growing with 18% YoY in 2023.
4. State and Parent Organization Overview
To identify the top states that have experienced growth this year, a precise technique of measuring approaches, including calculating total enrollment, net enrollment, and net enrollment contribution (net enrollment of State divided by total enrollment of that State), is undertaken.
As history repeats, California, Texas, and Florida have greater total enrollment, while Texas expanded with a greater gain in net enrollment, and Wyoming has the highest net enrollment contribution in 2023 among other States. It can be noted that UnitedHealth Group, Inc. is leading over the Western part while Humana Inc. is leading over the South-Eastern part.
4.1 State Overview
For Non-SNP total enrollment plans, California ranks best, whereas, for D-SNP, Florida ranks highest.
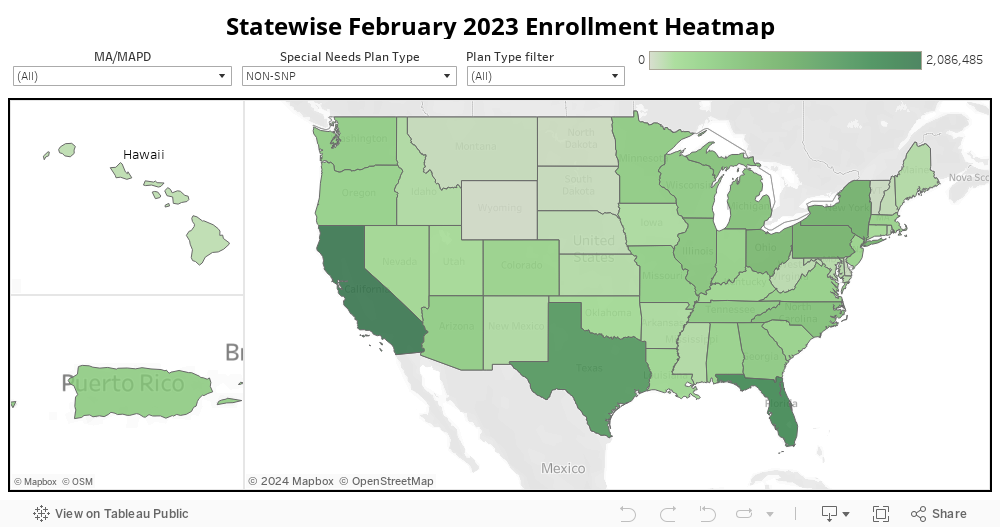
To determine the State which has more growth in the Medicare Advantage market based on total enrollment in February is visualized in the above heat map. For many years California, Florida, and Texas have long held the top spots in this market with respect to current total enrollment.
California has the largest net enrollment for D-SNP plans, while the state's Non-SNP net enrollment is the lowest.
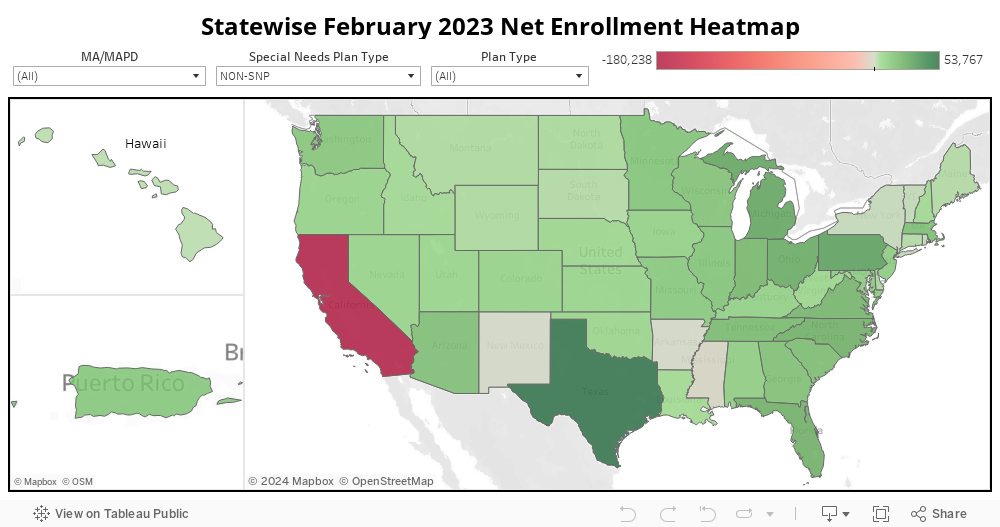
Focusing on the markets with the largest net enrollments YoY is an alternative method of assessing state-level success; from this, we can pinpoint the markets that are expanding the fastest. While this reduces the number of actual emerging markets, it also presents difficulties because these countries frequently have fiercely competitive markets.
The states with the largest net enrollment gain from December 2022 to February 2023 are depicted to be Texas, Florida, and Pennsylvania at the National level. Texas is in the first position for only Non-SNP plans, while Pennsylvania and Michigan have overtaken Florida to be in second and third positions.
Connecticut State has the lowest contribution (includes all plans and SNP types).
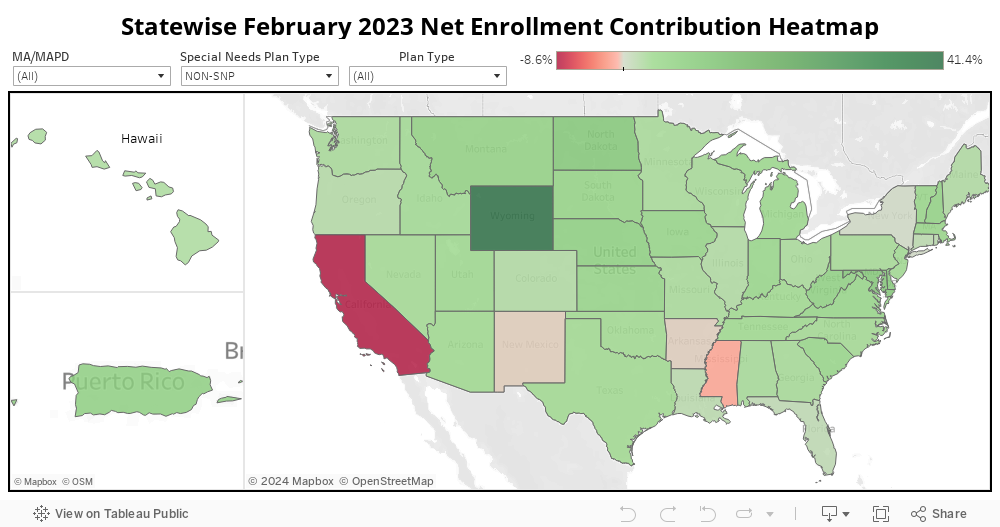
We can better identify markets with high potential by changing our strategy and calculating what proportion of the “total enrollment” was explained by the “net enrollment.” This indicator enables us to discover the states that are currently the most active and expanding at the highest rate for their size, called “emerging markets.”
The 2023 AEP period emerging markets are Wyoming, Alaska, and Maryland for all plan and SNP types. The States which are having lower net enrollment contributions over total enrollment are California, Mississippi, New Mexico, and Arkansas for Non-SNP plans.
4.2 Parent Organization Overview (Non-SNP)
UnitedHealth Group, Inc. and Humans Inc. cover most of the States.
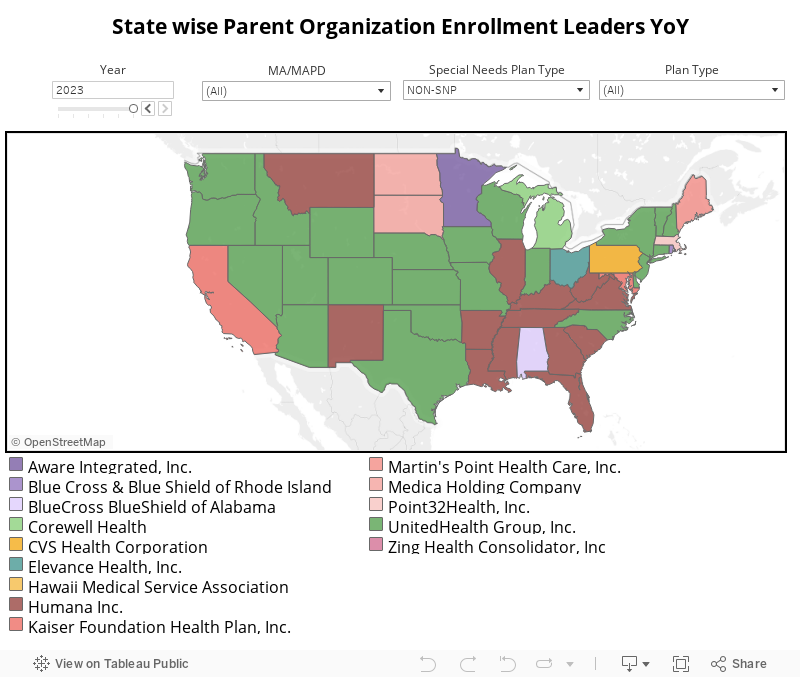
The above section concentrates on National Payors grouped by their Parent Organization at the National level; there may be better methods to assess genuine performance, but it will outline a few insights.
From 2019, UnitedHealth Group, Inc. and Humana Inc. are leading parent organizations in most states, covering about 30% and 25%, respectively.
As the year passes, UnitedHealth Group, Inc. has occupied more states. In 2023, UnitedHealth Group, Inc. alone has 44% of coverage among other organizations; it overtook Iowa from CVS Health Corporation.
Humana covers more than United Health Group in terms of net enrollment.
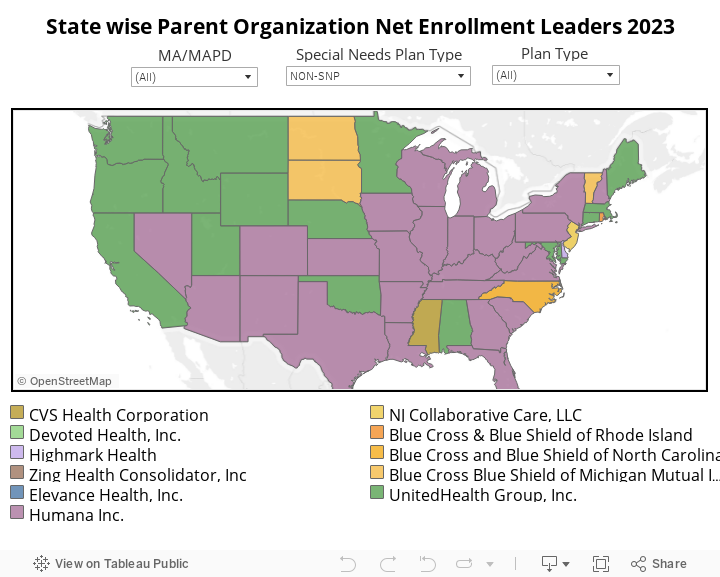
The map above represents the states in which National Payors are the leaders. It is important to note that even though these organizations lead a state, they might not be the leaders at the county level as these could be an organization that is extremely specific to that county. At the representation of net enrollment, Humana Inc. spread over 48%, followed by UnitedHealth Group, Inc. with 31%.
Conclusion
The post-AEP period of 2023 has come, and so far, this year’s AEP has shown some drastic results. The known fact is that the Medicare Advantage market is expanded year over year, with 25.6 million enrollees. The net growth in terms of plans option and enrollment is increasing at a slower rate.
Among the SNP types, Non-SNP plans rise was minimal, and C-SNP spiked a lot compared to previous years. The plan breakdown percentage was higher in Renewal Plans, and Renewal Plans with SAE at the National level, whereas the net enrollment contribution was greater from New Plans.
Zero-premium and Zero-drug deductible segments have significant enrollment and dominate the market. HMO plan enrollment is stagnant as the market widens, and PPO plans are growing significantly. Though there was an increase in all sectors that independently dominate the market, the growth rate is lagging as the year passes.