
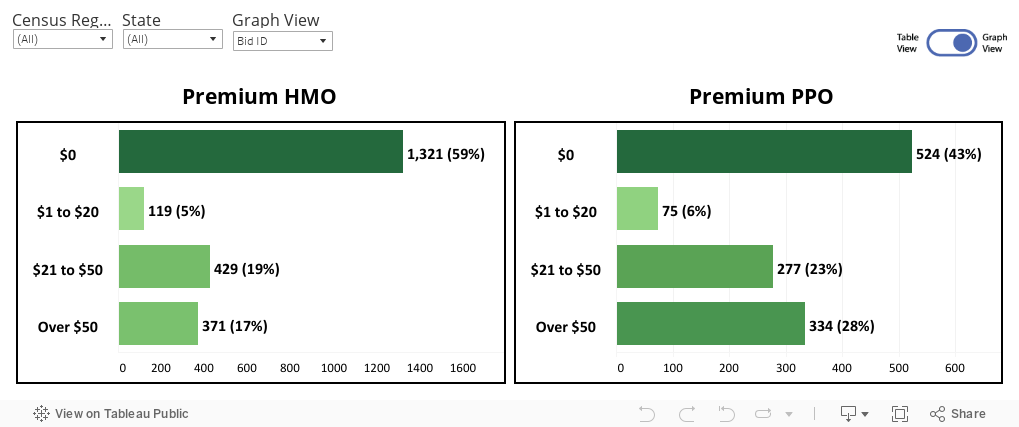
 Premium has always been one of the top cost factors, and zero-dollar premium is currently dominating the market. All three cuts of plan type (HMO, PPO, and combined HMO & PPO) across all nine regions saw high growth in the zero-premium segment. In fact, there were very few regions in which PPO had premium identified as an Insignificant factor. In addition, even though zero-premium saw much higher net enrollments, the $1-$20 premium plans saw a higher net enrollment per Bid ID in some regions.
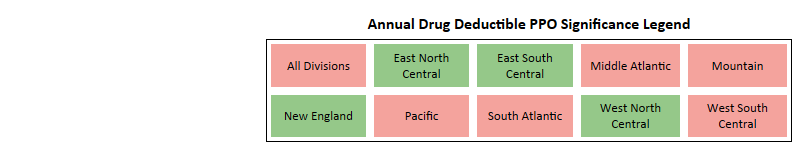
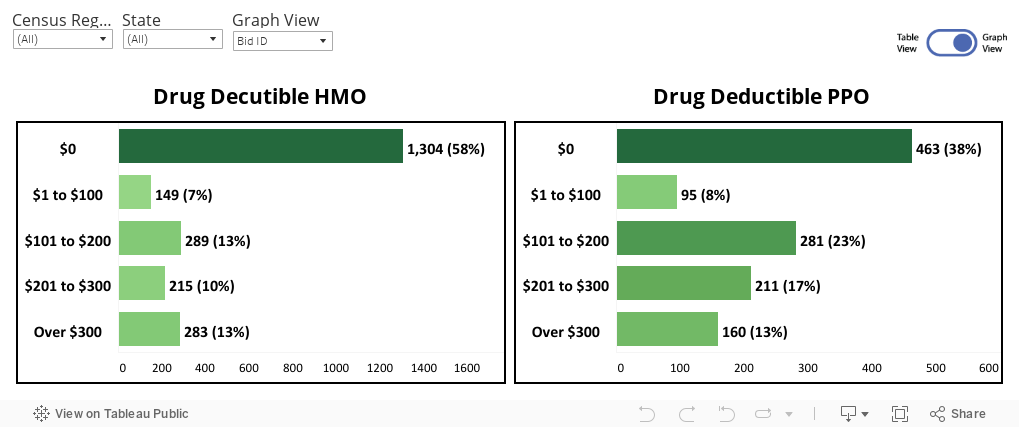
 Zero-dollar drug deductible plans have gained the most enrollments, both at an overall and HMO level, and is generally seen as a Significant factor. For HMO plans, zero drug deductible has attained the highest net enrollment across the board. However, non-zero plans have had higher net enrollments per Bid ID in a few regions. PPO plans, on the other hand, presents a very different story. Zero-dollar has the highest net enrollment overall and dominate most regions in terms of net enrollment and net enrollment per Bid ID. The most popular non-zero buckets are the $101-$200 and $201-$300 segments. One region, Mountain, has $300 plus as the dominant bucket for both net enrollment and net enrollment per Bid ID. Because of such high variance in dollar preference, annual drug deductible is an Insignificant factor for PPO.
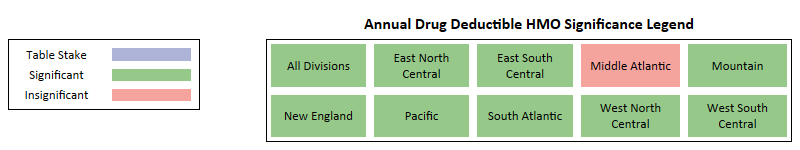
 MOOP presents as an impactful plan attribute, however, HMO and PPO behave very differently and the significance is unique to each region. HMO plans, for example, mostly favor MOOP costs around the $2,000 to $6,000 range. It’s clear from the data that beneficiaries prefer a lower MOOP in HMO plans as many regions have gained max net enrollment on the lower end of the scale ($2,000 to $4,000), with some being very low ($0 to $2,000). The only outlier is the New England region, where the eligible preference lands at $6,000+ plus.
On the other hand, PPO plans favor the $6,000 plus range, with most regions having gained max net enrollment in that higher end of the spectrum. East North Central, Mountain, and West North Central are the only outliers where a MOOP of $2,000 to $6,000 was preferred. Overall, the data suggest that beneficiaries aren’t deterred from a higher MOOP when purchasing PPO plans.
MOOP presents as an impactful plan attribute, however, HMO and PPO behave very differently and the significance is unique to each region. HMO plans, for example, mostly favor MOOP costs around the $2,000 to $6,000 range. It’s clear from the data that beneficiaries prefer a lower MOOP in HMO plans as many regions have gained max net enrollment on the lower end of the scale ($2,000 to $4,000), with some being very low ($0 to $2,000). The only outlier is the New England region, where the eligible preference lands at $6,000+ plus.
On the other hand, PPO plans favor the $6,000 plus range, with most regions having gained max net enrollment in that higher end of the spectrum. East North Central, Mountain, and West North Central are the only outliers where a MOOP of $2,000 to $6,000 was preferred. Overall, the data suggest that beneficiaries aren’t deterred from a higher MOOP when purchasing PPO plans. 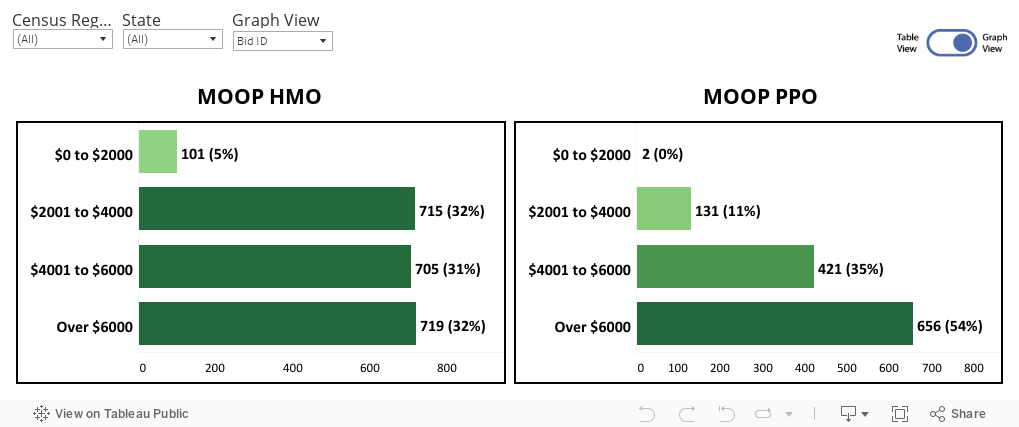
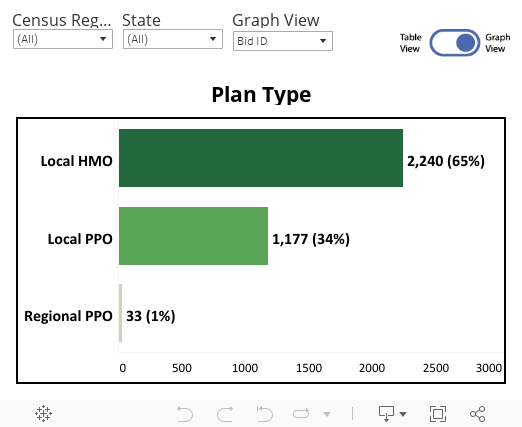
 For years HMO plans have dominated enrollments in the Medicare Advantage market. However, with the current rise of PPO over the past few years, there is a shift in the status quo. Between HMO and PPO plans, fewer PPO plans have captured a larger number of net enrollments, indicating that PPO is becoming the new standard preference. Specifically, zero-dollar premium plans. Therefore, Plan Type, while currently Insignificant, in time, will become a Significant factor favoring zero-dollar PPO plan type.
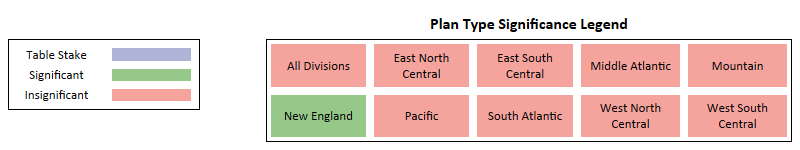
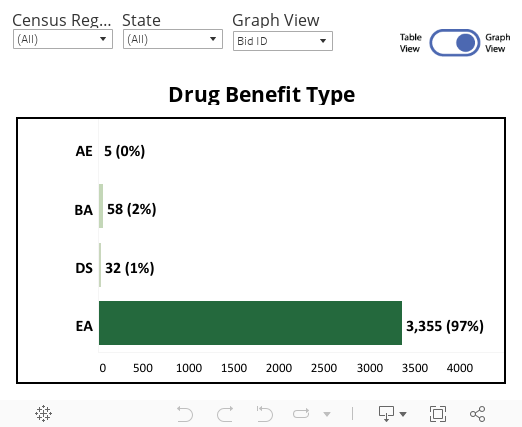
 A Defined Standard drug benefit type is identified as the bare minimum drug coverage a plan must provide. In many ways it’s the type of plan that other plans are judged against. From the data it’s quite obvious that both beneficiaries and payors prefer a more robust drug coverage, with 97% of all plans being EA (Enhanced Alternative), capturing 98% of net enrollments. Hence, drug benefit type identifies as Insignificant with nearly no variance in the data.
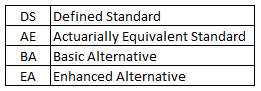
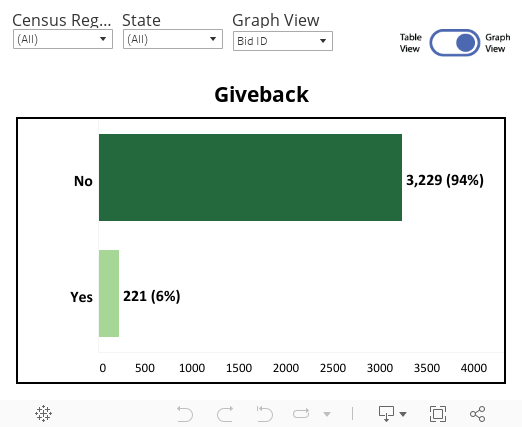
 The giveback benefit, also known as Part B premium reduction, is when a Medicare Advantage plan reduces the amount you pay towards your Part B monthly premium. While there are a low number of plans that provide giveback, there has been an uptick in recent years. Currently, only 6% of plans offer giveback, capturing 11% of the net enrollments. Hence, giveback often shows as Insignificant due to a lack of consistent correlation in the market. As giveback continues to rise, we expect this to become a significant driver in some regions.
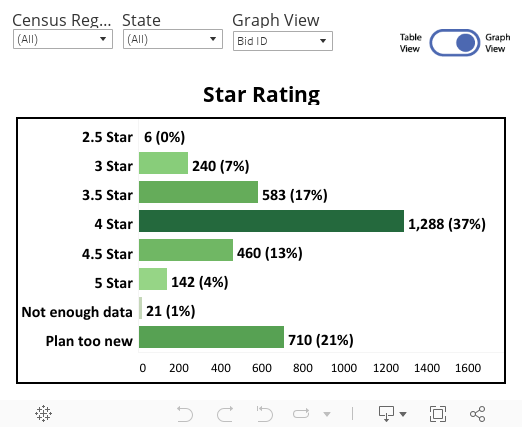
 As expected, most plans with a star rating of 4 and higher captured the highest enrollments. However, an increased number of net enrollments went towards new plans with no star rating, indicating that other attributes within the plan design factor towards higher enrollments. Due to this, statistically, star rating continues to show as Insignificant. However, star ratings, when known, are a vital indicator towards enrollment. When analyzed at the state or county level, where new plans have less impact, stars often presents itself as more significant versus the rolled up regional or national analysis.
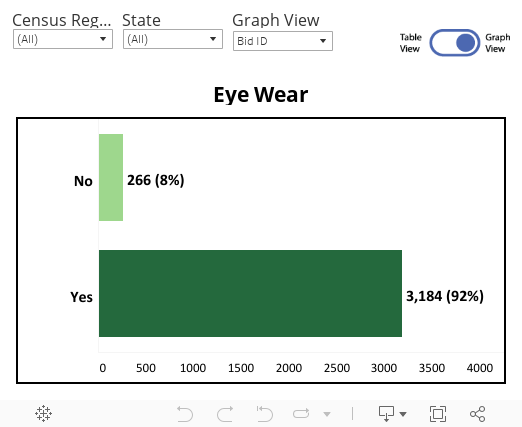
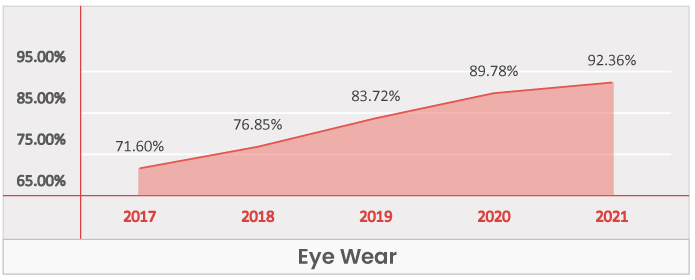
 Eyewear inclusion has grown by nearly 20% in the past five years. Present in 71.6% of plans in 2017, it has risen to 92.4% in 2021. PPO plans saw far stronger growth than HMO, increasing from 61.4% in 2017 to 90.7% in 2021. The growth of this benefit as resulted in it becoming Table Stakes in every market. In fact, with such a high beneficiary preference, Original Medicare is strongly considering adding Eye Wear as a mandatory benefit.
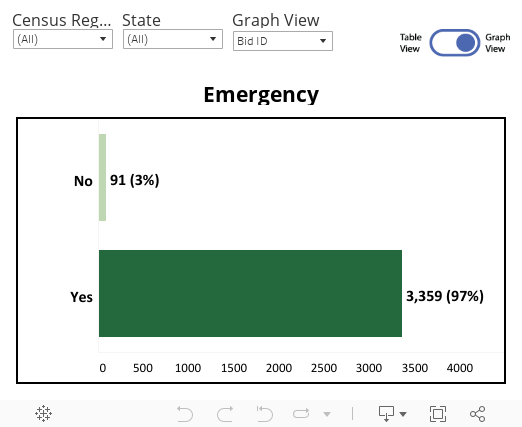
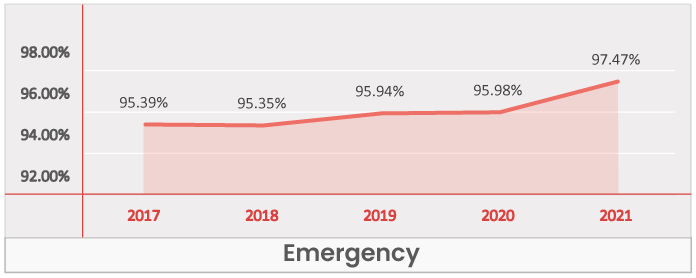
 Worldwide emergency is one of the benefits that has been present in most of the plans across the county for the past five years. It was present in 95.4% of the plans in 2017 and 97.5% of plans in 2021. Therefore, this benefit is identified as a Table Stake and something that every plan should offer.
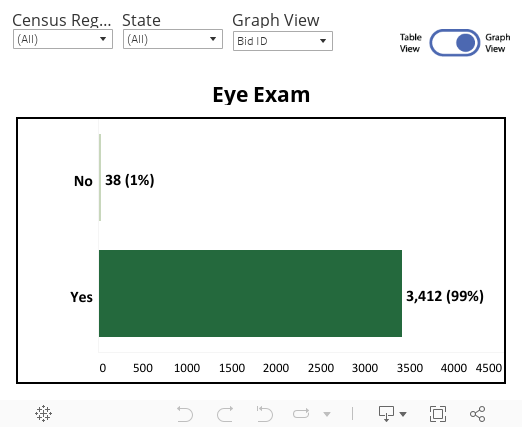
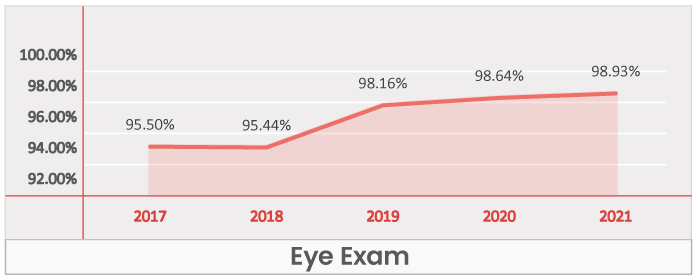
 Eye exam has always been one of the top benefits in the market for the past five years. It was present in 95.5% of the plans in 2017 and is present in 98.9% of plans in 2021. This benefit is widely considered Table Stake and not including it will undoubtedly lead to enrollment loss. Similar to eye wear this benefit, it may soon be part of Original Medicare.
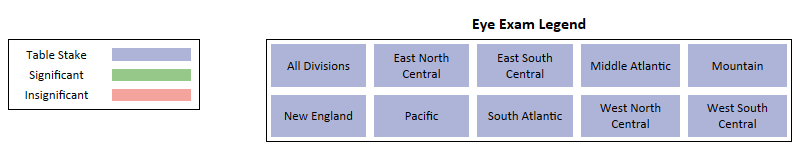
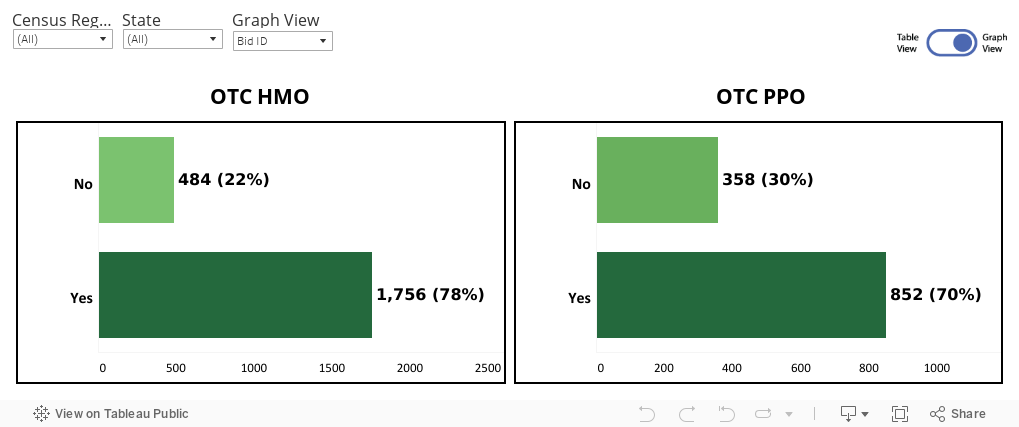
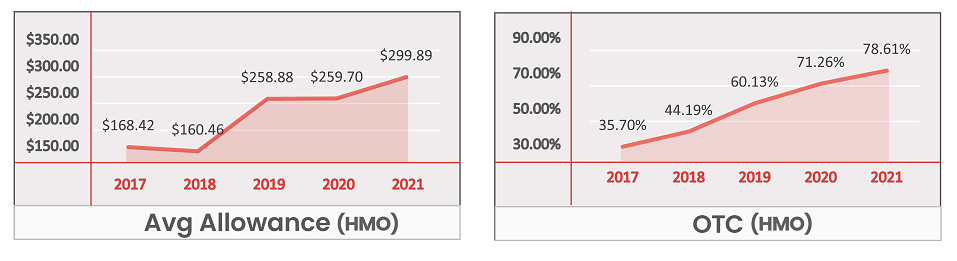
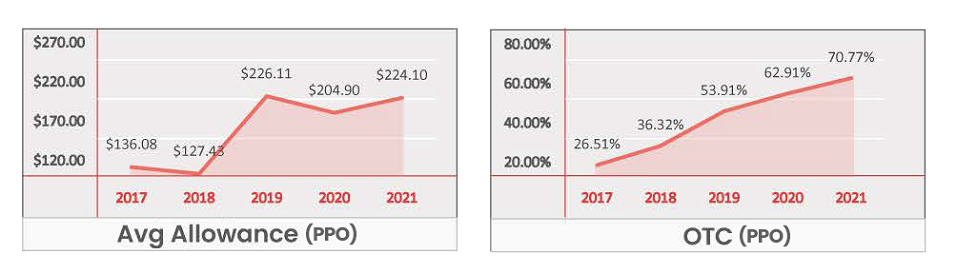
 OTC is one of the fastest-growing benefits, increasing in offering from 33.1% in 2017 to 75.9% in 2021. OTC is a Table Stake for HMO plans as there is no region where plans without an OTC benefit gained net enrollments. However, PPO plans tell a different story. Overall, PPO plans with OTC have captured the most net enrollments, however, a dive into each region shows multiple where plans not offering an OTC benefit have also gained net enrollments. Due to this, some regions for PPO identify this benefit as Insignificant. Diving deeper into the allowances, HMO plans have an average allowance of $300 per annum, while PPO plans have an average allowance of $224.
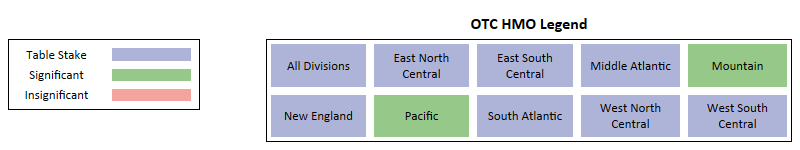
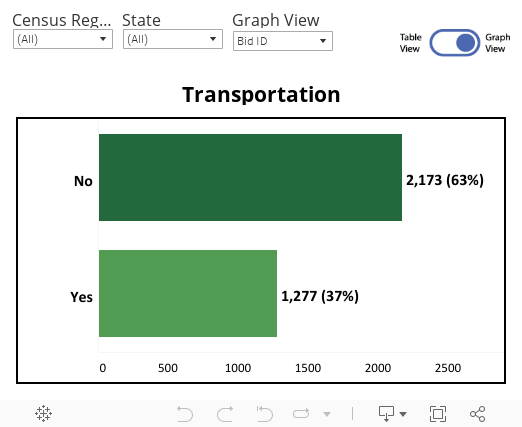
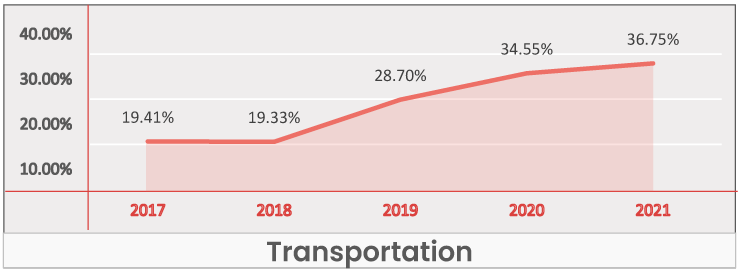
 While both HMO and PPO witnessed continuous inclusion growth in the past five years; PPO grew by 42.7%, from 43.7% in 2017 to 86.4% in 2021. At an overall level, this benefit has grown from Significant to a Table Stake over the past four years and not offering this benefit will undoubtedly have a negative effect enrollment growth.
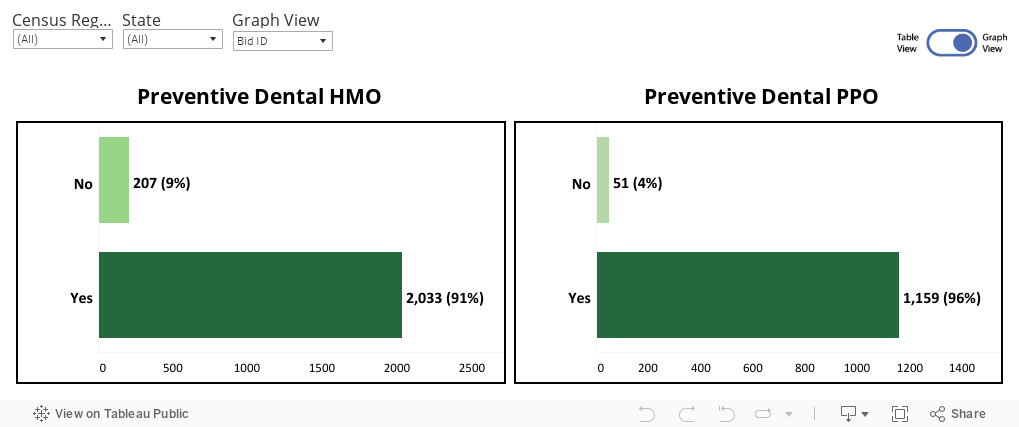
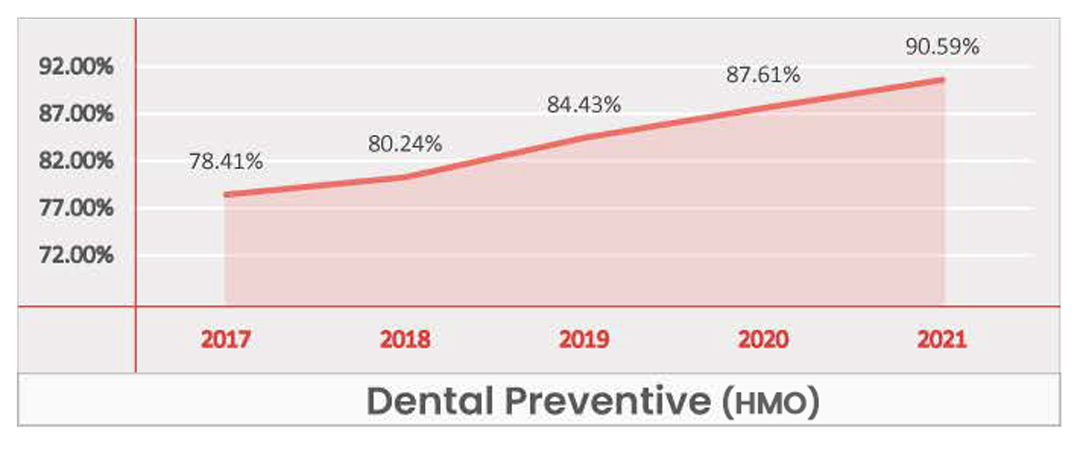
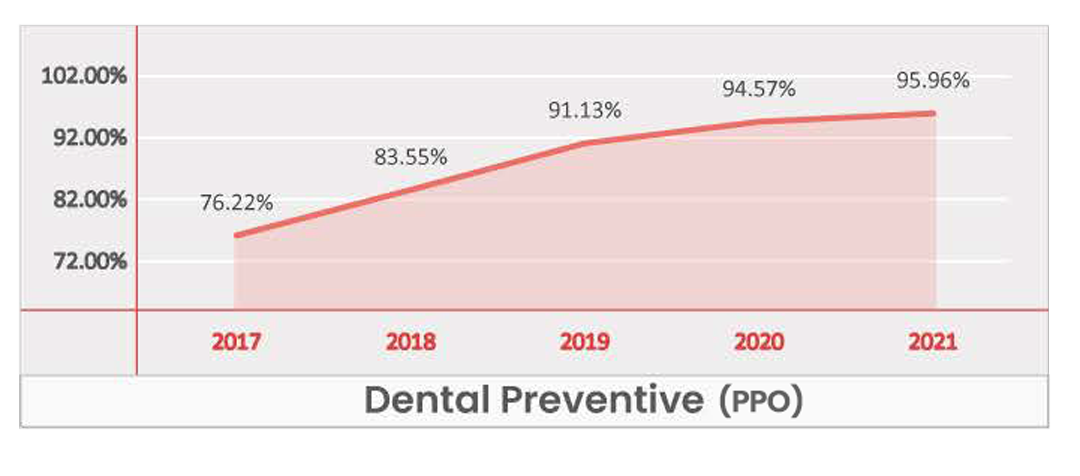
 With a 15% growth in the past five years, preventive dental has always remained one of the top benefits in terms of inclusion. From 77.8% in 2017 to 92.5% in 2021, this benefit has grown to become a Table Stake, and presents a major influence on enrollment growth potential across all regions.
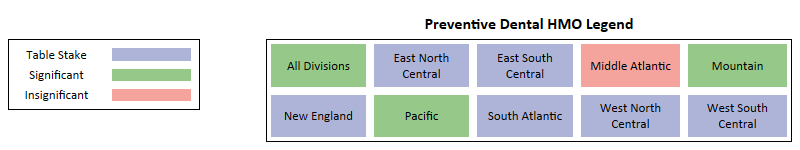
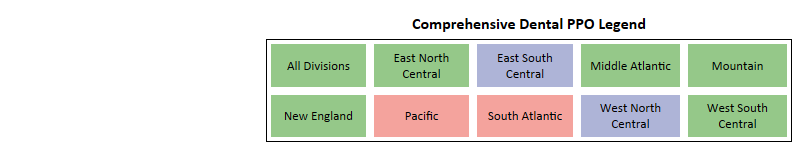
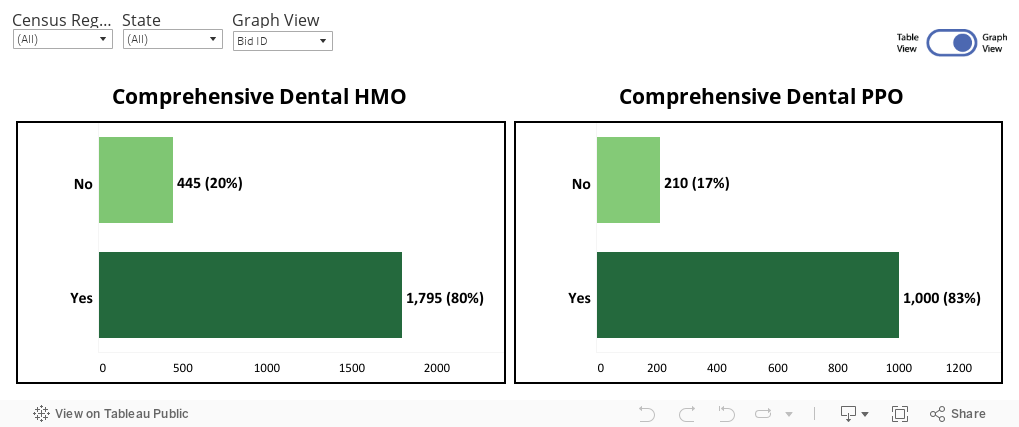
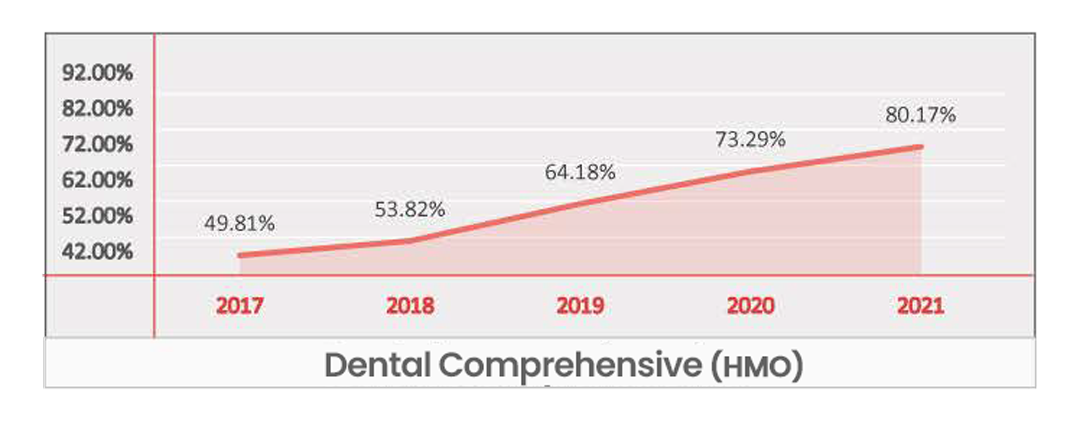
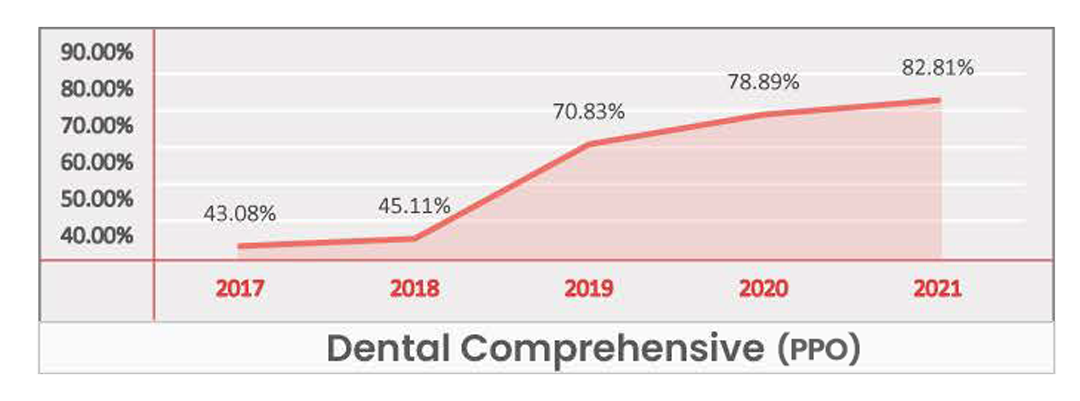
 Now present in over 81% of the plans, comprehensive dental has seen a 33% growth in the past five years. The results of our xAI analysis identifies this benefit is Significant across the board, and Table Stake in some regions. With a continued increase in inclusion, Comprehensive Dental is set to become a Table Stake across all regions within the next couple years. With such a strong growth rate, Payors have identified Comprehensive Dental as a crucial benefit for beneficiaries, further supported by our analysis.
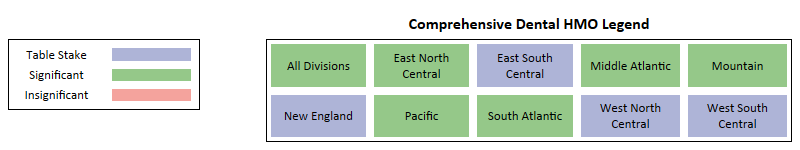
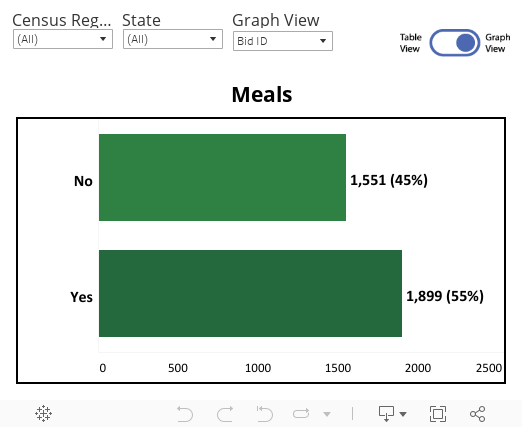
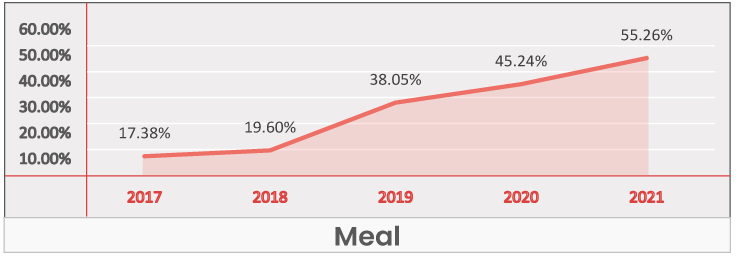
 Witnessing a 38% growth in the past five years, Meal Services have grown from 17.4% in 2017 to 55.3% in 2021. However, the results of the xAI analysis identifies this as an Insignificant benefit in all regions but one. This indicates that even though the Meal benefits have grown substantially, beneficiaries generally aren’t influenced in plan selection by the inclusion.
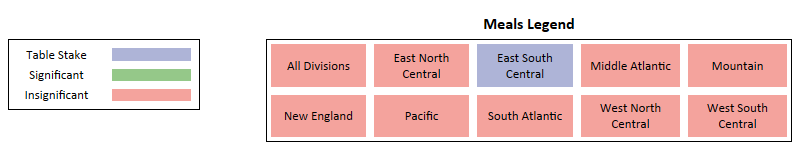
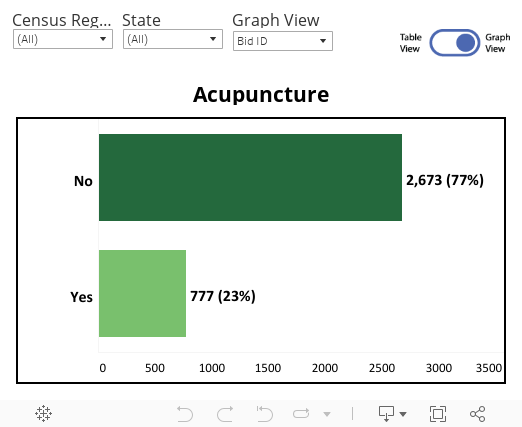
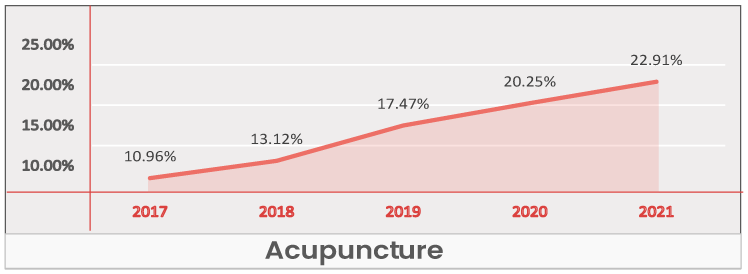
 Driven mainly by HMO, Acupuncture has grown in inclusion by nearly 12% in the past five years, at an overall level. It was present in 10.9% of the plans in 2017, growing to nearly 23% of plans in 2021. However, even with growth nationally, this benefit is identified as Insignificant across all regions with little to no identifiable influence on net enrollment gain.
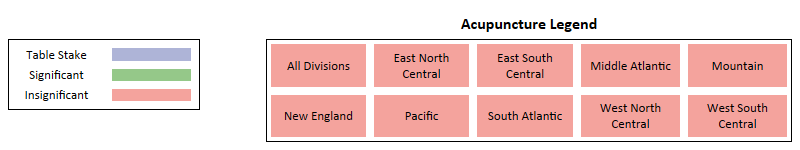
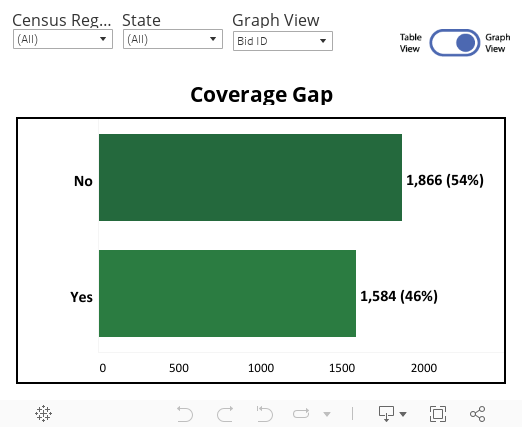
 Identified as Insignificant in our xAI analysis, 54% of the plans without Coverage Gap captured 69% of the enrollments in 2021. For HMO, the split between the percentage inclusion in plans and the percentage enrollment capture is nearly equal but in favor of without, while for PPO, 56% of the plans without Coverage Gap captured 82% of the enrollments.