The Evolving Landscape of Medicare Advantage Benefits: Trend Analysis
Supplemental, Enhanced, SSBCI, Optional, and Combined Benefits.
July 21, 2023 Market Research

Overview
Benefits play a prominent role in the plan selection process of beneficiaries; however, the number of benefits & their varying structure may also confuse enrollees when forced to choose between various options.
Supplemental benefits play an extremely important role in the selection process, along with cost factors, though the specific benefits having the most impact may change year to year and market by market. Special Supplemental Benefits for the Chronically Ill (SSBCI), also contribute to beneficiary selection, however, this benefit category is still relatively new to the market.
Recognizing the importance of the various benefit categories, the following report provides a segmented analysis of Medicare Advantage plan designs year-over-year to better understand the various trends impacting the market.
These insights are based on the analysis of Non-Special Needs Plans (Non-SNP) listed in the Landscape files published by the Centers for Medicare and Medicaid Services (CMS). The information presented allows readers to understand the essential benefits under the benefits matrix of plan coverage, track benefit offerings over the past five years (or more), compare states using a benefits coverage index, and explore the categories of Optional and Combined benefits.
For a more comprehensive view of data, insights, and trend analysis at the State-County level, readers may choose to access the HealthWorksAI platform. To obtain access to the platform, please reach out to us at info@healthworksai.com.
Benefit Structure
Original Medicare (OM) and Medicare Advantage (MA) plans both offer benefits, though MA plans typically provide a more comprehensive range of options. Plans aim to attract beneficiaries by offering additional benefits beyond the minimum coverage or enhancing the benefits offered by OM while maintaining competitive costs.
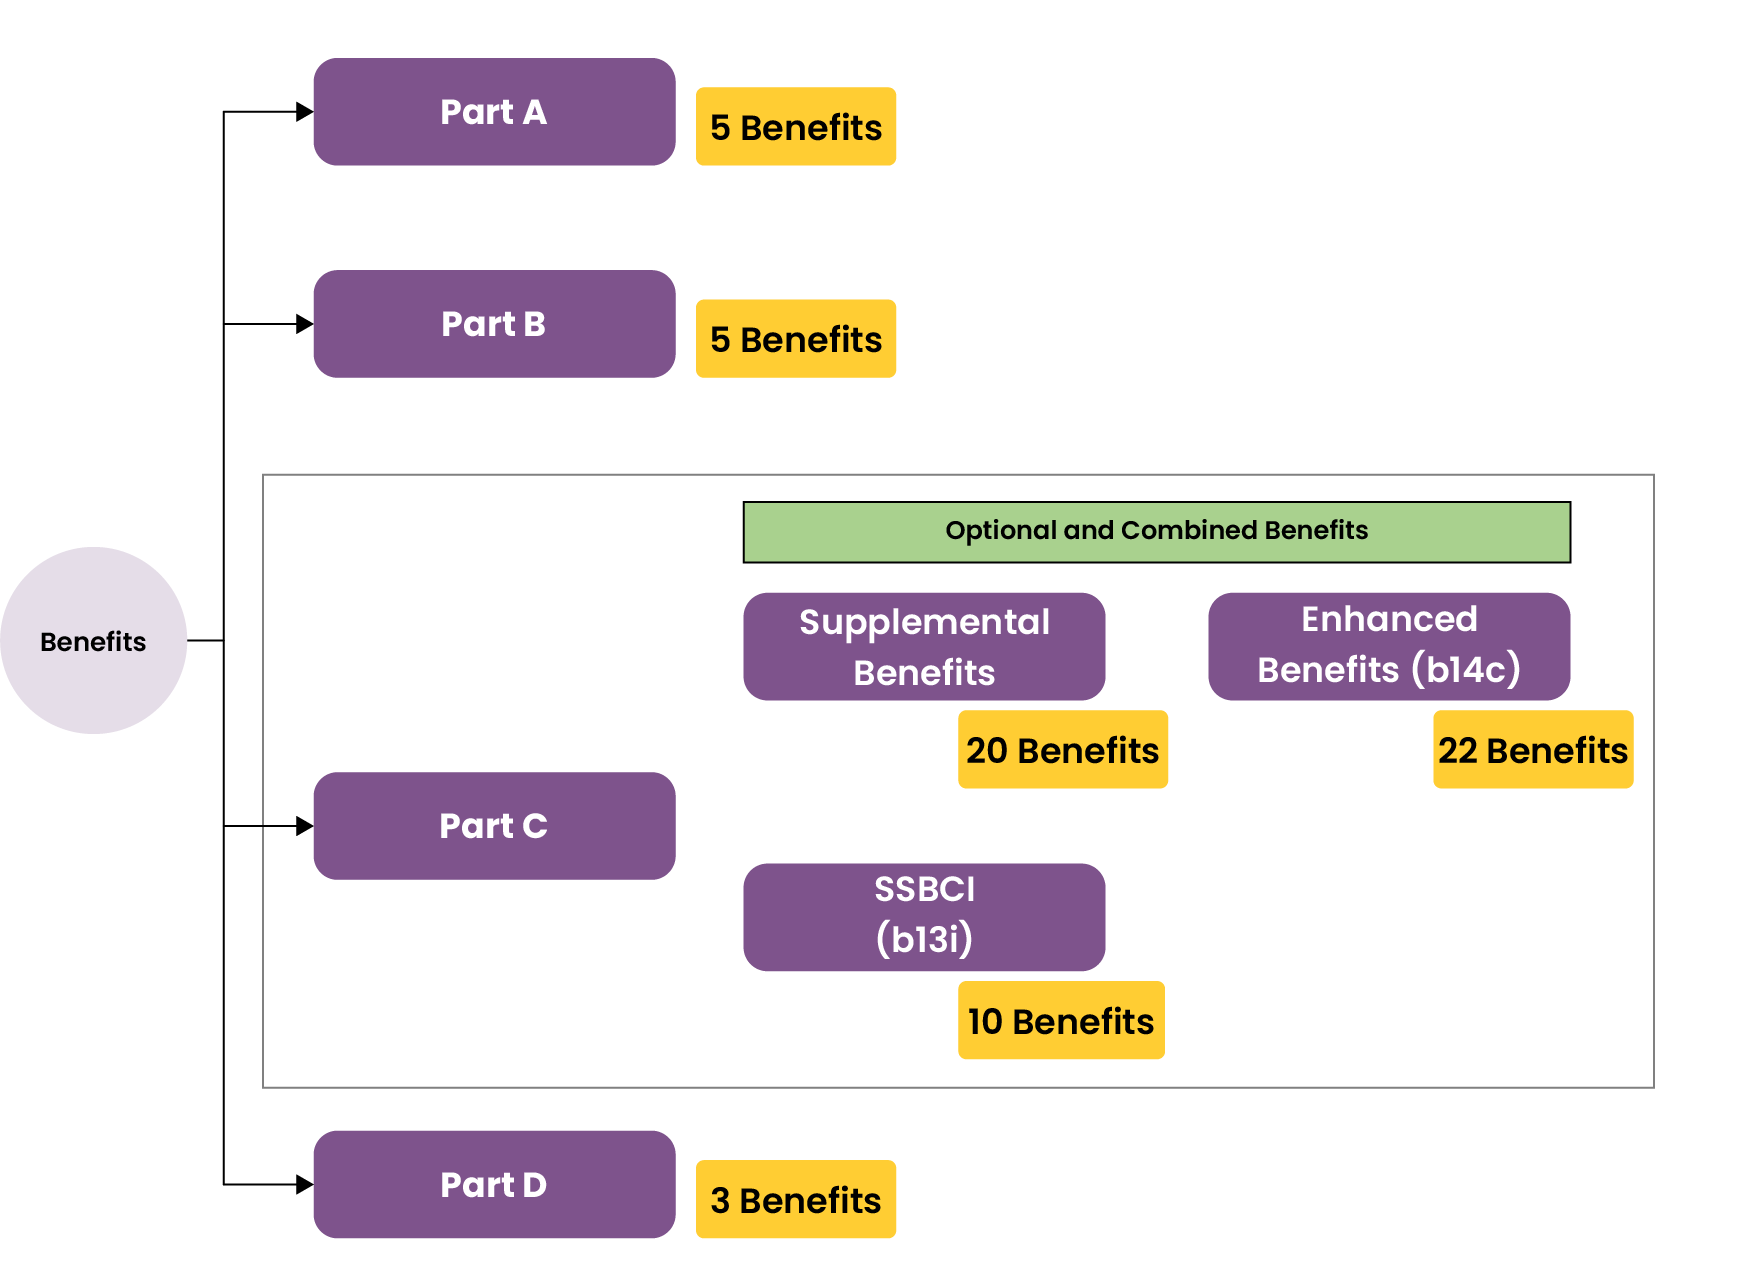
The primary benefits covered by OM are split into two sections, Part-A* and Part-B**, each of which has five benefits as seen in the flowchart according to broad benefit categories. Services including Inpatient Hospital care, Skilled Nursing Facilities (SNF), Nursing Homes, Home Health Care, and Hospice are covered in Part-A while Part-B covers Provider Services, Ambulance, Preventive Medicine, Durable Medical Equipment (DME), and Home Health Services.
The benefits provided by Medicare Advantage plans which exceed those covered by OM are covered by Part-C and are known as Supplemental benefits. They can be further broken down into the SSBCI and Enhanced benefit categories, each of which includes additional protection for the beneficiaries who are at risk.
There are 22 sub-benefits that comprise the Enhanced benefit category and another 10 for SSBCI. Furthermore, there are two other benefit categories—Optional and Combined—which may also have an impact on beneficiary selection.
Optional benefits are extra services that members can select from in accordance with their requirements and preferences, but which are not offered by OM and likely require additional premiums.
Combined benefits are a plan design element that combines Supplemental benefits into groups with a maximum plan benefit amount. Services including Dental, Vision, and Hearing are most common in both categories, however, many others are also made available as either Optional or Combined benefits.
Click here to read more about Part-A* benefits.
Click here to read more about Part-B** benefits.
Benefit Matrix of Plan Coverage
Most states, apart from Hawaii, Maryland, Louisiana, Wyoming, and New Jersey offer OTC benefits at a rate exceeding 70%.
One critical element to be examined is the evolution of “Table stakes” benefits, those considered as an essential minimum requirement for plans to remain competitive in their respective market. These benefits are viewed as intrinsic to the package and play a vital role in beneficiary decision-making.
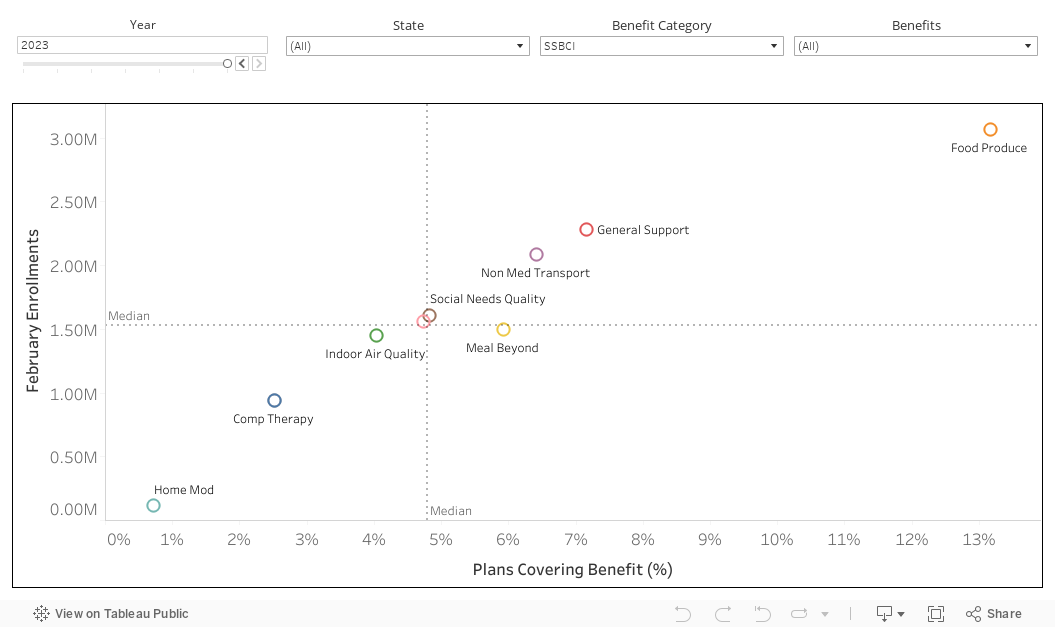
The benefit matrix provides information on plan coverage, with the benefits exceeding a certain threshold identified as Table Stakes in both the Supplemental and Enhanced categories. The scatter plot, or 2X2 matrix, visually represents the set of Table Stakes benefits in each State, with the number of enrollees under each benefit indicated.
It makes no inference that the chosen benefit and the corresponding enrollments are correlated, which requires the application of explainability models, but does indicate a strategic focus by Payors to meet the needs of the market. Median lines on the axes facilitate the separation of higher coverage benefits and enrollments. The table provides dropdown filters further aid in evaluating coverage and enrollment status within this category more effectively.
Eye Exams and Enhanced benefits occupy the top two positions with respect to plan and enrollment coverage since 2018 out of other Supplemental benefits, while among Enhanced Benefits – Fitness is the only one considered as Table Stake. On the other hand, SSBCI continues to slowly grow from an inclusion perspective, with no benefits reaching Table Stake status. The Food Produce benefit is the most prominent, having tripled its plan coverage since 2021, while the Meal benefit declining since last year, with a share of only 6% in the current year.
The trend of Optional benefits is also interesting in relation to a percentage share as it had previously been recorded at 41% in 2017 before witnessing a minor reduction in 2019 (38%), a slight increase in 2020, and a gradual decline from that point on, hitting 30% in 2023. At the same time, the plan coverage of Combined benefits began extremely low in 2021 (just 3%), before jumping to 64% in 2022 and reaching 71% in 2023.
Going deeper, in most states, major coverage was seen in benefits like Emergency, Vision, Dental, Hearing, Enhanced benefits, Outpatient Blood, Inpatient Hospital, or Physical Exam, among different Supplemental benefits.
Surprisingly, in Puerto Rico, which has an extremely mature MA market with high penetration, Transportation has the highest coverage. The least covered benefits, in most states, are Psychiatry and Chiropractic care while Cardiac, SNF, and Acupuncture services were minimally offered in a few states.
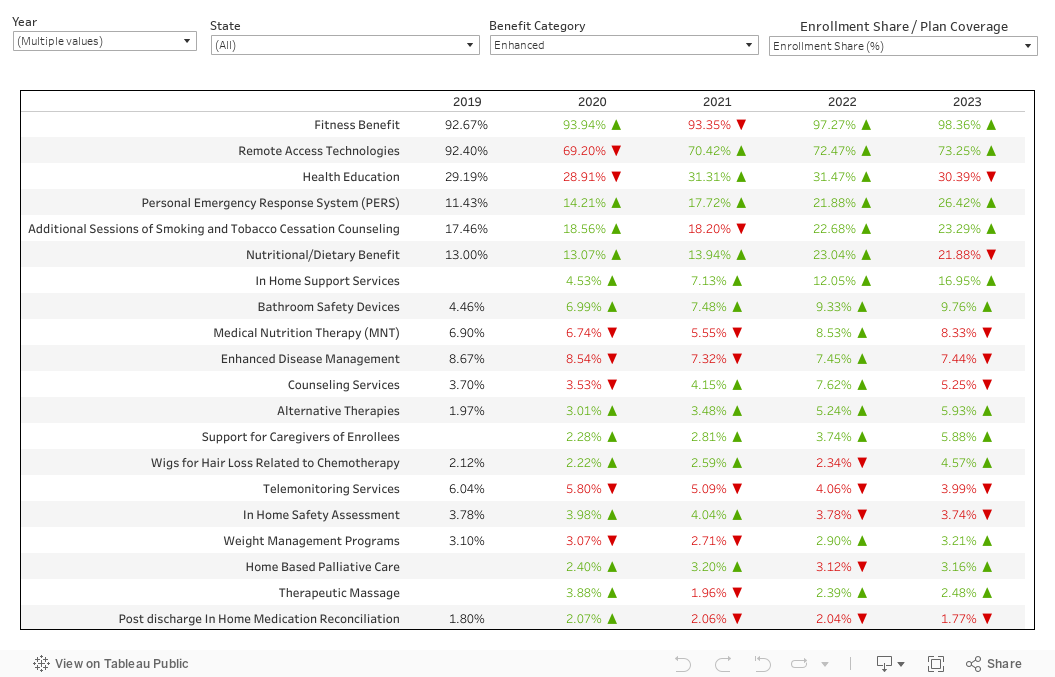
Fitness benefit ranks highest under Enhanced benefits with coverage of more than 90% in all the states except for Montana (80%) and Puerto Rico (86%), while Personal Emergency Response System (PERS) and Weight Management Programs are the second most covered benefits in Louisiana and Massachusetts, Remote Access Technologies are second in all the other states. Except for Idaho, Maine, New Hampshire, Oregon, Utah, and Washington, which have good coverage for Meals, all the other states that offer SSBCI benefits have the highest plan coverage for Food Produce.
Also, New Mexico has the greater coverage for the Social Needs Quality benefit, while Oklahoma and Vermont have the highest coverage for the General Support benefit. In New York, Combined benefits are included at the lowest national rate of 45% while Minnesota has the highest inclusion rate of 95%. Lastly, while Puerto Rico is the only State to not offer Optional benefits, the level of coverage for this category varies from 2% in Florida to 63% in California.
Medicare Plan Finder (MPF) Listed Benefits Index
20 states had index 1 for Worldwide Emergency benefit, whereas 15 states had index 1 for Fitness.
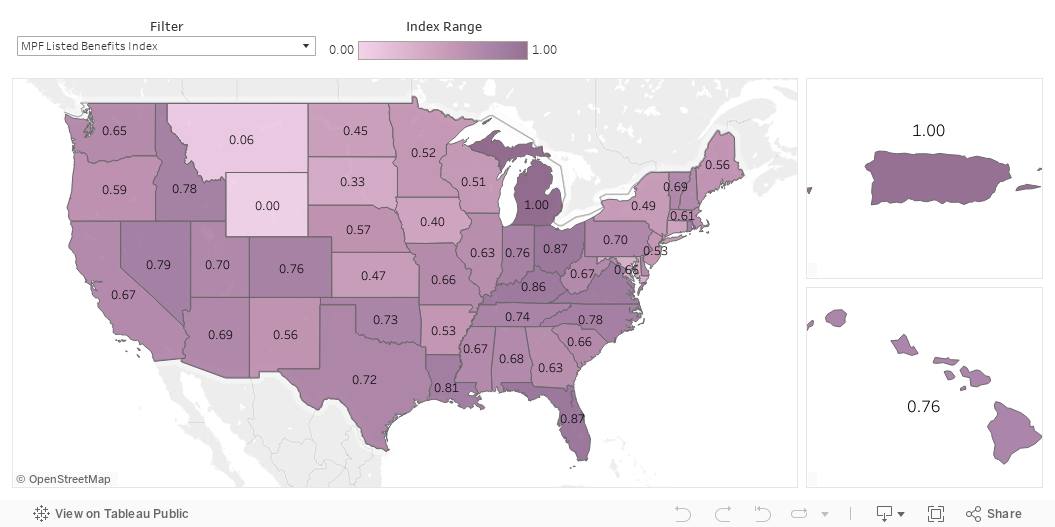
The MPF website, powered by CMS, is a popular resource for beneficiaries to compare plans. It emphasizes the coverage of 11 specific benefits, indicating their perceived importance. This section focuses on these benefits and uses the MPF Listed Benefits Index to assess their availability across states.
The index is calculated by normalizing the coverage of these benefits, assigning a value between 0 and 1 to each state. Wyoming represents the minimum coverage with an index of 0, while Michigan & Puerto Rico represents the maximum coverage with an index of 1.
All other states are indexed relative to these extremes. It’s important to note that an index of 0 doesn’t mean a State offers no benefits coverage but indicates it offers the lowest coverage level relative to all others.
Benefit Coverage by Plan Type
PPOs have a much higher pace of coverage growth across all benefits compared to HMOs.
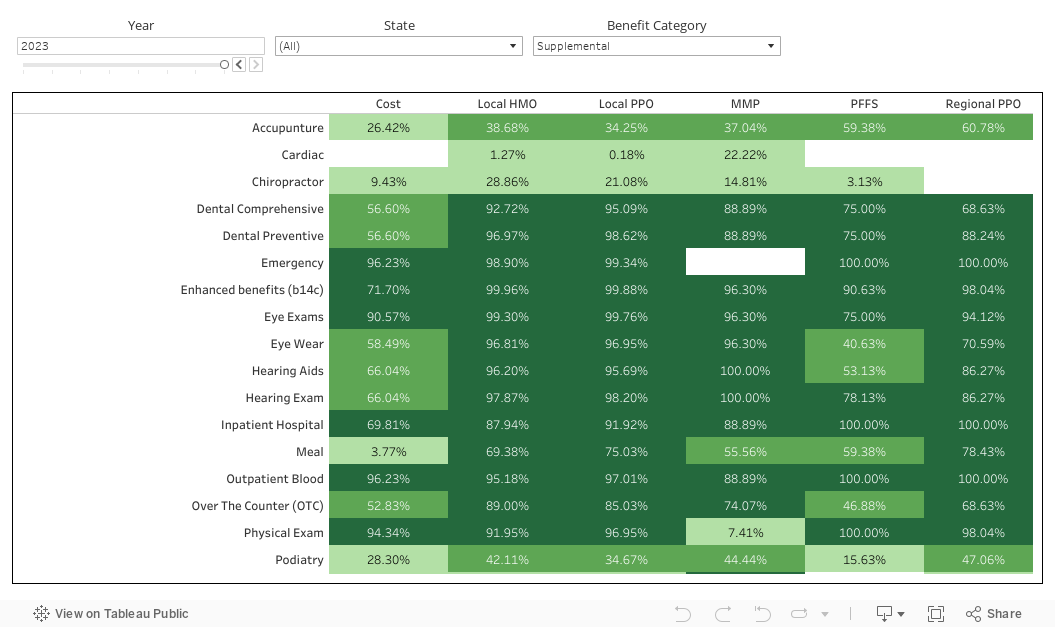
Along with Enhanced benefits, Eye Exams, and Emergency benefits – Dental, Vision, and Hearing are covered by HMOs and PPOs at more than 90% at the National level, leading all other Supplemental benefits, excluding Fitness which is offered in nearly all plans.
This is followed by OTC at 89% for HMO and 84% for PPO. Meals, another benefit with high inclusion, saw covered at 70% in HMOs and 75% in PPOs. The Fitness benefit, as referenced earlier in this paragraph, is the most prominent being offered, with HMO inclusion at 98.5% and PPO at 99.7%.
In terms of SSBCI benefits, Food Produce ranks first for the second consecutive year at 17% (HMO) and 9% (PPO). Looking at the Optional and Combined packages, the latter is included in 74% of PPO plans and 70% of HMOs, up from 72% and 62% respectively. Optional, however, is only offered in ~30% of plans in both.
Besides witnessing a minor decline in Psychiatry services, HMO plans displayed an upward trend in coverage for all Supplemental benefits compared to the prior year. However, every one of the benefits under PPO plans increased.
While all other benefits either decreased or stayed the same under the Cost plan type, only Dental Comprehensive showed an increase in coverage, and the MMP plans for Cardiac underwent the same observation. Among the Enhanced benefit category, HMOs, Cost, and Regional PPOs saw a drop in coverage in most benefits, but PPOs noticed an increase in almost all the benefits except for Counseling Services.
For SSBCI benefits, Home Modification in both HMO and PPO plans saw a downward trend, along with Meal and Pest Control for HMO plans only. Combined benefits noticed increasing in coverage in all plan types, unlike Optional benefits, which saw a decline except for a very little rise in Regional PPO.
Year-over-Year (YoY) Benefit Coverage Trend
Medical Nutrition Therapy (MNT) has decreased marginally after years of consistent growth since 2017.
Apart from Psychiatry and SNF, the remaining 18 Supplemental benefits witnessed an increase in both enrollment and plan share. Eye Exams and Emergency are in the top tiers; and though Eye Exams saw a dip in 2022, it has rebounded this year.
OTC, one of the most prominent benefits, had an enrollment share of ~ 60% back in 2019 but has risen to ~90% this year. This reflects as the third highest YoY growth, succeeded by Meal and Dental Comprehensive with a 7% and 6% rise, reaching ~77% and ~95% of total enrollment coverage, respectively.
Out of the 22 different Enhanced benefits available, Fitness and Remote Access Technology benefits have the most extensive coverage. They not only have a high enrollment share, with 98.3% and 73.6%, respectively, but they also boast impressive plan coverage rates.
However, the remaining benefits have 30% or less coverage. PERS has shown steady growth since 2017 in terms of the plan and enrollment coverage (1.6% and 0.8%) and has now risen to 21% and 26%, respectively, and has the second highest YoY rise among Enhanced benefits. However, the first is In-Home Support Services from 10.3% to 14.3% for plan coverage and 11.9% to 16.9% for enrollment. Counselling Services have experienced a significant reduction in plan coverage, dropping by one-third from 12% in 2022 which is 4% currently.
Meal Beyond, the leading benefit in SSBCI, has been declining since 2022 both in enrollment and plan coverage percentage. In contrast, the second highest plan coverage among SSBCI benefits is General Support with 7% which also tops the first spot in terms of YoY enrollment share at about 11% in 2023, compared to 4% in 2022. This is followed by Food Produce at 15% in 2023 and 9% in 2022.
The enrollment coverage for Optional and Combined Benefits is 33% and 75%, respectively. At the state level, the variation is discrete for both benefits. There are states which contradicted the national trend of Optional benefits, like Alabama, Georgia, Texas, and Virginia, showing an increase in plan coverage.
New Jersey has maintained consistency in YoY plan coverage, while the enrollment has decreased from 2022. As for Combined benefits, Minnesota observed the largest plan and enrollment coverage, at roughly 95% and 98%, respectively.
Optional and Combined Benefits
Under this section, the details about the plans which are offering these benefits are briefed by breaking down the cluster along with details on the different packages offered.
a. Packages
26 percent of plans that offer Combined benefits have two packages, compared to 20 percent of plans that offer Optional benefits.
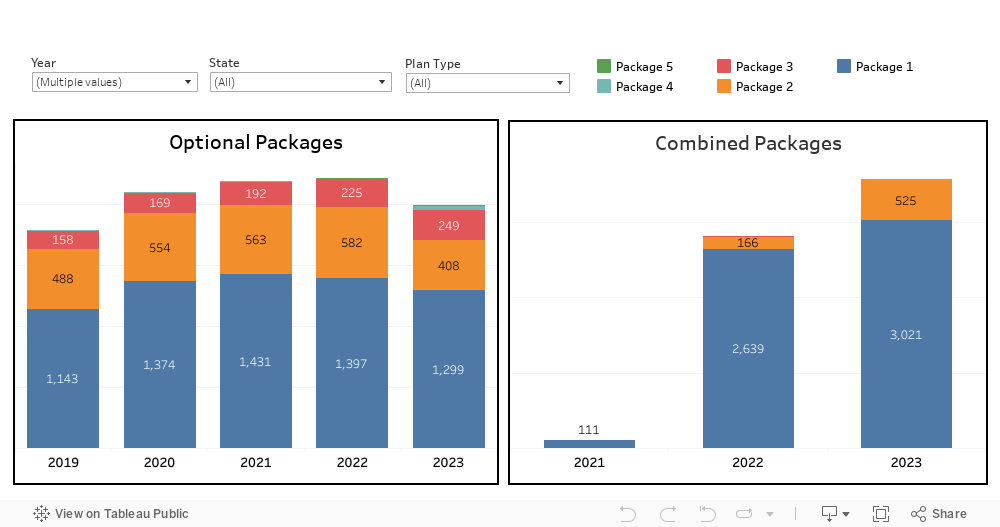
Packages will not always differ based on the benefits offered, sometimes they will be varied according to the cost factors or coverage. For a single plan, there may be multiple packages offered. Plans currently have a maximum of five Optional benefits packages while Combined benefits have four. The package dashboard tells us how many plans have been provided in the different packages.
Out of the total Non-SNP plans present in the MA market, 30% have at least one Optional benefit package and 70% have one Combined benefit package. About 408 plans have two Optional benefit packages down by 582 in 2022; however, three, four, and five package plans have increased over the years.
The proportion of plans providing two Combined benefit packages has seen a hike from 4% of all Non-SNP plans from last year to 12% now. However, three and four packages are negligible, less than 1%.
b. Benefits Breakdown
Comprehensive Dental is the most popular benefit in terms of coverage as an Optional benefit, and the least popular is taken by Meal.
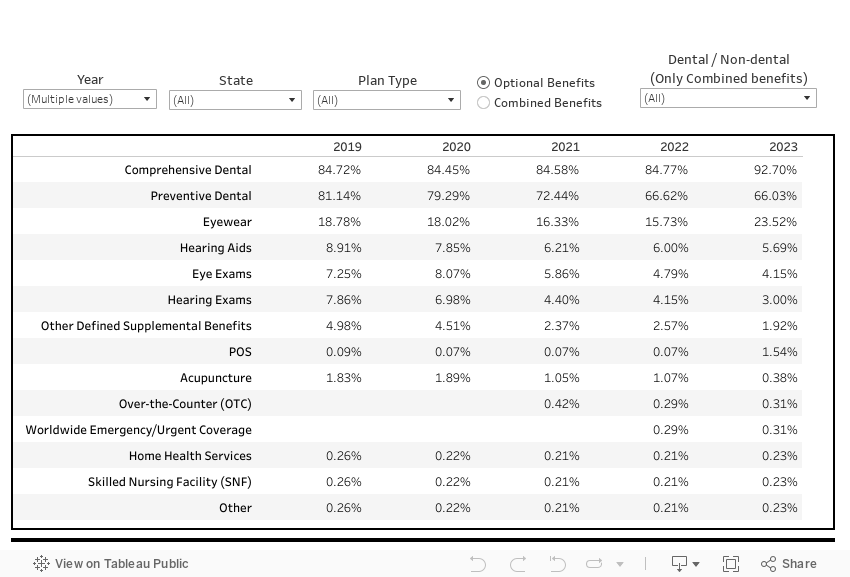
Supplemental and Enhanced benefits are offered as Optional and Combined benefits, which when provided under the bundled several benefits, provide beneficiaries with the maximum coverage possible under selected benefits. The percentages tabulated here are out of the plans offering as Optional or Combined with respect to the filters selected. Evidently, there is fluctuation in trend among the different benefits provided as Optional; however, the largest coverage was seen in the Comprehensive Dental benefit at ~93% and Preventive Dental with 66%.
No other benefits exceeded 66% coverage in 2023. The Point of Service (POS) benefit saw some growth as an Optional benefit this year, with a rise from 0.07% to 1.54%, and although it’s minimal, this change is a result of the conversion of multiple HMO plans to HMO-POS earlier this year.
To analyze the trend among Combined benefits, we have grouped the benefits into Dental and Non-Dental categories, considering that most of the coverage is from Dental benefits. We have applied an additional filter to further break down the data for a more focused analysis.
Dental X-rays occupy the first place in Combined Dental benefits with 90.3%, followed by Prophylaxis (Cleaning) and Oral Exams. The percentage of Non-dental benefits was higher in 2021 because of fewer Combined benefits, while after that, in 2022, the number of Combined benefits increased drastically, decreasing the coverage share.
Eyeglasses, Contact lenses, and Hearing aids are the table toppers in 2023 for Non-Dental benefits with 20% of coverage out of Combined benefits offered. There were also drastic increases in Fitting for a Hearing Aid, Routine Eye Exams, Routine Hearing Exams, Eyeglass Lenses, Frames, and Upgrades. OTC has 9% inclusion this year compared to 6% last year, and with the increase in OTC coverage across mandatory offerings, we may see this continue to rise. In 2021, the top benefit was Fitness, but with respect to YoY growth, it fell slightly over the following two years, however, the number of plans increased from 274 (2022) to 287 (2023).
c. Comparison of Optional and Supplemental Benefits Plan Coverage
When it comes to Optional benefits, Eyewear comes in third place, and for Supplemental benefits, it comes in sixth place.
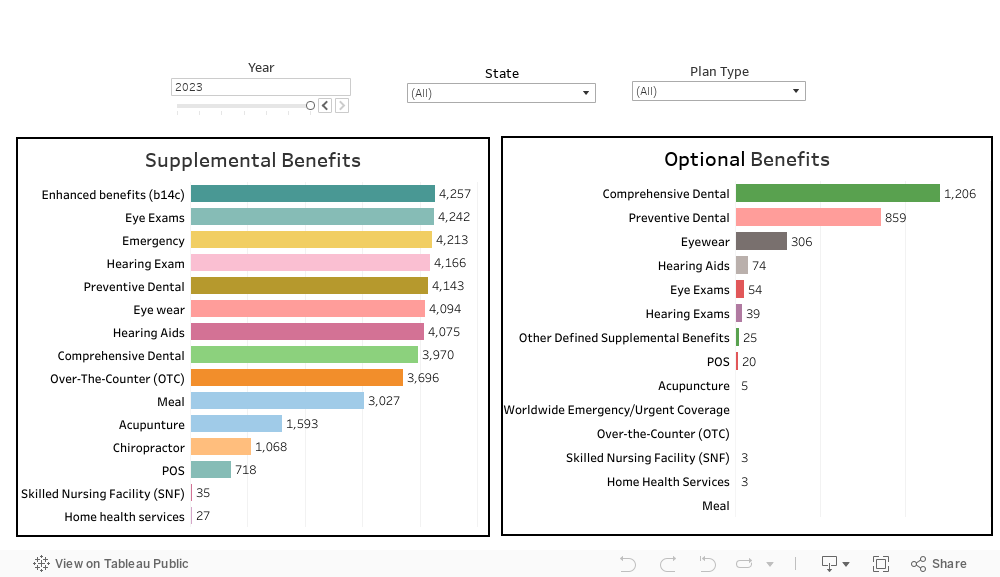
This dashboard displays the number of plans having Supplemental and Optional benefits. It tells us how YoY the count changed in both the benefits. Under Supplemental benefits, the highest count of plans has been from Enhanced benefits since 2017. However, with respect to Optional benefits, Preventive Dental was at the top for plan count till 2018, when it was overtaken by Comprehensive Dental.
There are no significant changes under Supplemental benefits; Preventive Dental restored its fifth position, which was defeated by Eyewear in 2020. Apart from Comprehensive Dental in 2021, all the benefits offered as Optional have seen a diminishing trend or remained the same, while in 2022, it was only Other defined Supplemental benefits that saw an increase from the previous year.
However, Comprehensive Dental regained its growth in 2023 after a dip last year, currently with a total plan of 1,206 but still less than 2021 (1,212). This year, Eyewear and POS also increased from 220 to 306 and from only one to 20 plans, respectively.
Summary
The study shows that the coverage of specific benefits in Medicare Advantage has similarities and differences. As the Medicare Advantage market continues to evolve, new benefits are expected to become Table Stakes, while others will undergo significant changes year-over-year as payors seek innovative ways to differentiate themselves. By considering different market variables, Product Managers should focus on designing complex benefit packages and must analyze regional factors to create appealing plans that remain relevant.
Many of the Supplemental benefits have enrollment rates and plan coverage above 95% (like Emergency, Outpatient Blood, Dental, Vision, Hearing, etc.), but in the case of Enhanced benefits, only Fitness is included in this category. The trend for Optional benefits has been reduced for the past two years in a row by 4% annually, and if the pattern continues, the following projection for 2024 would be approximately 26%.
Combined benefits are becoming prominent by increasing the plan coverage year-over-year, majorly with Dental benefits. Among different plan types, HMOs experienced an average year-over-year growth of 4% for all Supplemental benefits, while PPOs had a higher average growth rate of 21% and Regional PPOs at 9%. Similarly, PPOs showed a 36% average YoY growth rate in Enhanced benefits, whereas HMOs had a more modest average growth rate of 4%.
The number of plans offering multiple Optional benefit packages is increasing, while the number of plans offering at least one is decreasing. Combined benefits, however, have seen increases across single and multi-package plans.
Considerations
- This study was carried out using Landscape data and the February Enrollment files from the last 7 years released by CMS.
- Plans with no enrollment or enrollments of less than 10 total have been excluded from the study. Also, this study focuses only on Non-SNP plans.
- Alaska does not feature in this study as it is not included in the Landscape file released by CMS.
- A zero value in the MPF Index does not indicate that the value present for the State is zero. Instead, it shows us that the State has the lowest value of % Benefit.
- The number of enrollees shown under each benefit within this analysis indicates the number of Medicare eligibles who have opted for a plan with said benefit and does not imply a correlation between selected benefits and monthly enrollments.
- Any blank values in the various graphs or tables indicate no data available based on the selected filters.