2022 AEP
Findings Report
October 21, 2021 Report
The Medicare Advantage (MA) ecosystem is maturing at a rapid pace. Each year Payors attempt strategic investments into their Plan Benefits Packages (PBP) to gain a competitive edge. Often, Payors elect to follow industry trends, both regional and national, while others attempt to become Mavericks of the market. Regardless of the direction, staying in tune with ongoing, and predicted trends is an indication of future opportunities for a constantly growing market. As of October 2021, enrollment in MA has exceeded 27.5 million, a 9.9% increase over the 25 million enrolled in a Part-C Plan last year. To meet the growing demand, Payors across the country increased the number of plans available by 452 for 2022, a rise of 9%.
This report highlights the major Plan & Benefit factors for the MA market as provided by the AEP data release by CMS earlier this month. This includes year-over-year (YoY) trends and variations of the MA market and cuts by plan type, cost structures, and benefit categories. Beginning with an overview of national-level variations for each primary plan type, we then dive deeper into plan design, where we examine beneficiary cost factors and benefit inclusions.
National Overview
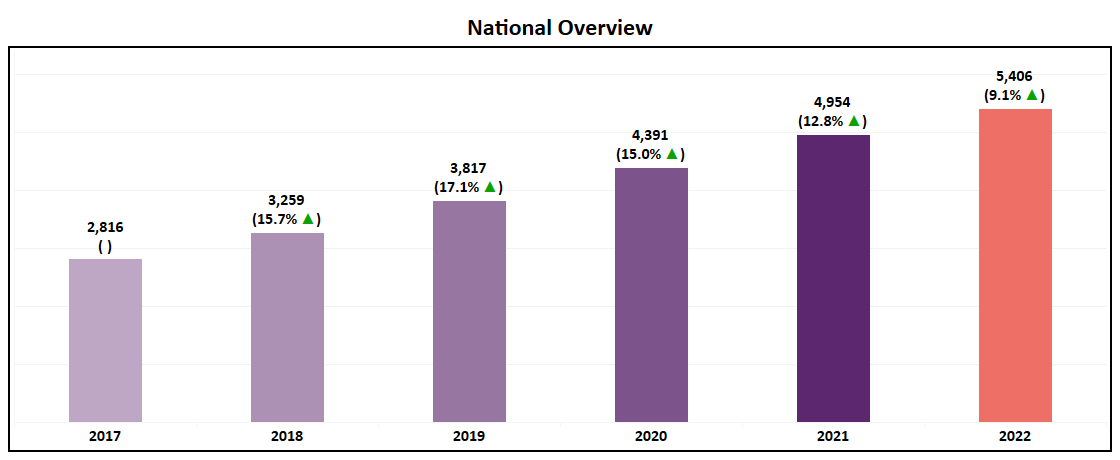
- At an overall level, the number of plans available in the MA market will grow 9% YoY, taking the total number of plans to 5,406 in 2022.
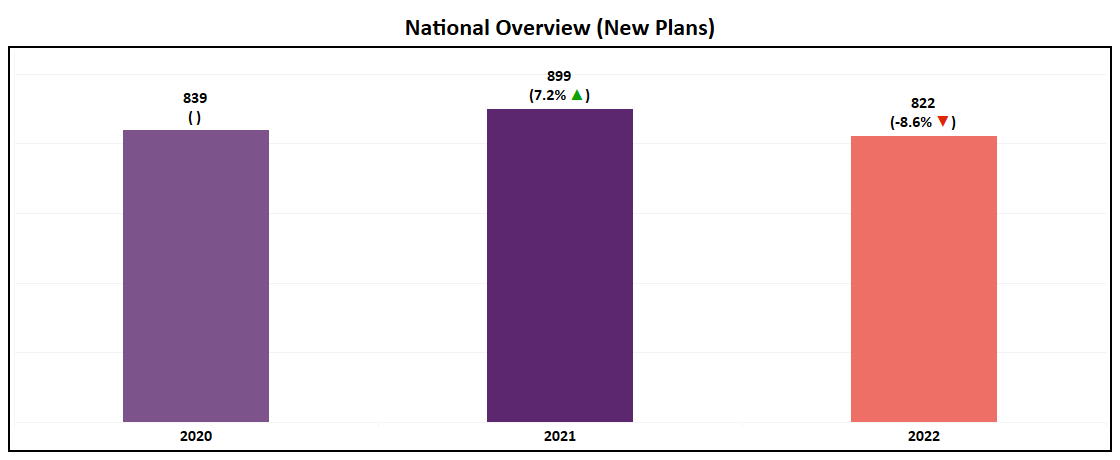
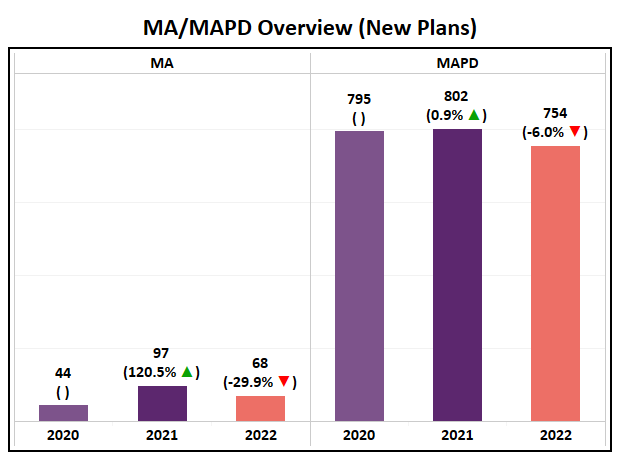
- Over 800 new plans will be introduced in 2022, a slight reduction from the 899 new plans launched for the 2021 AEP.
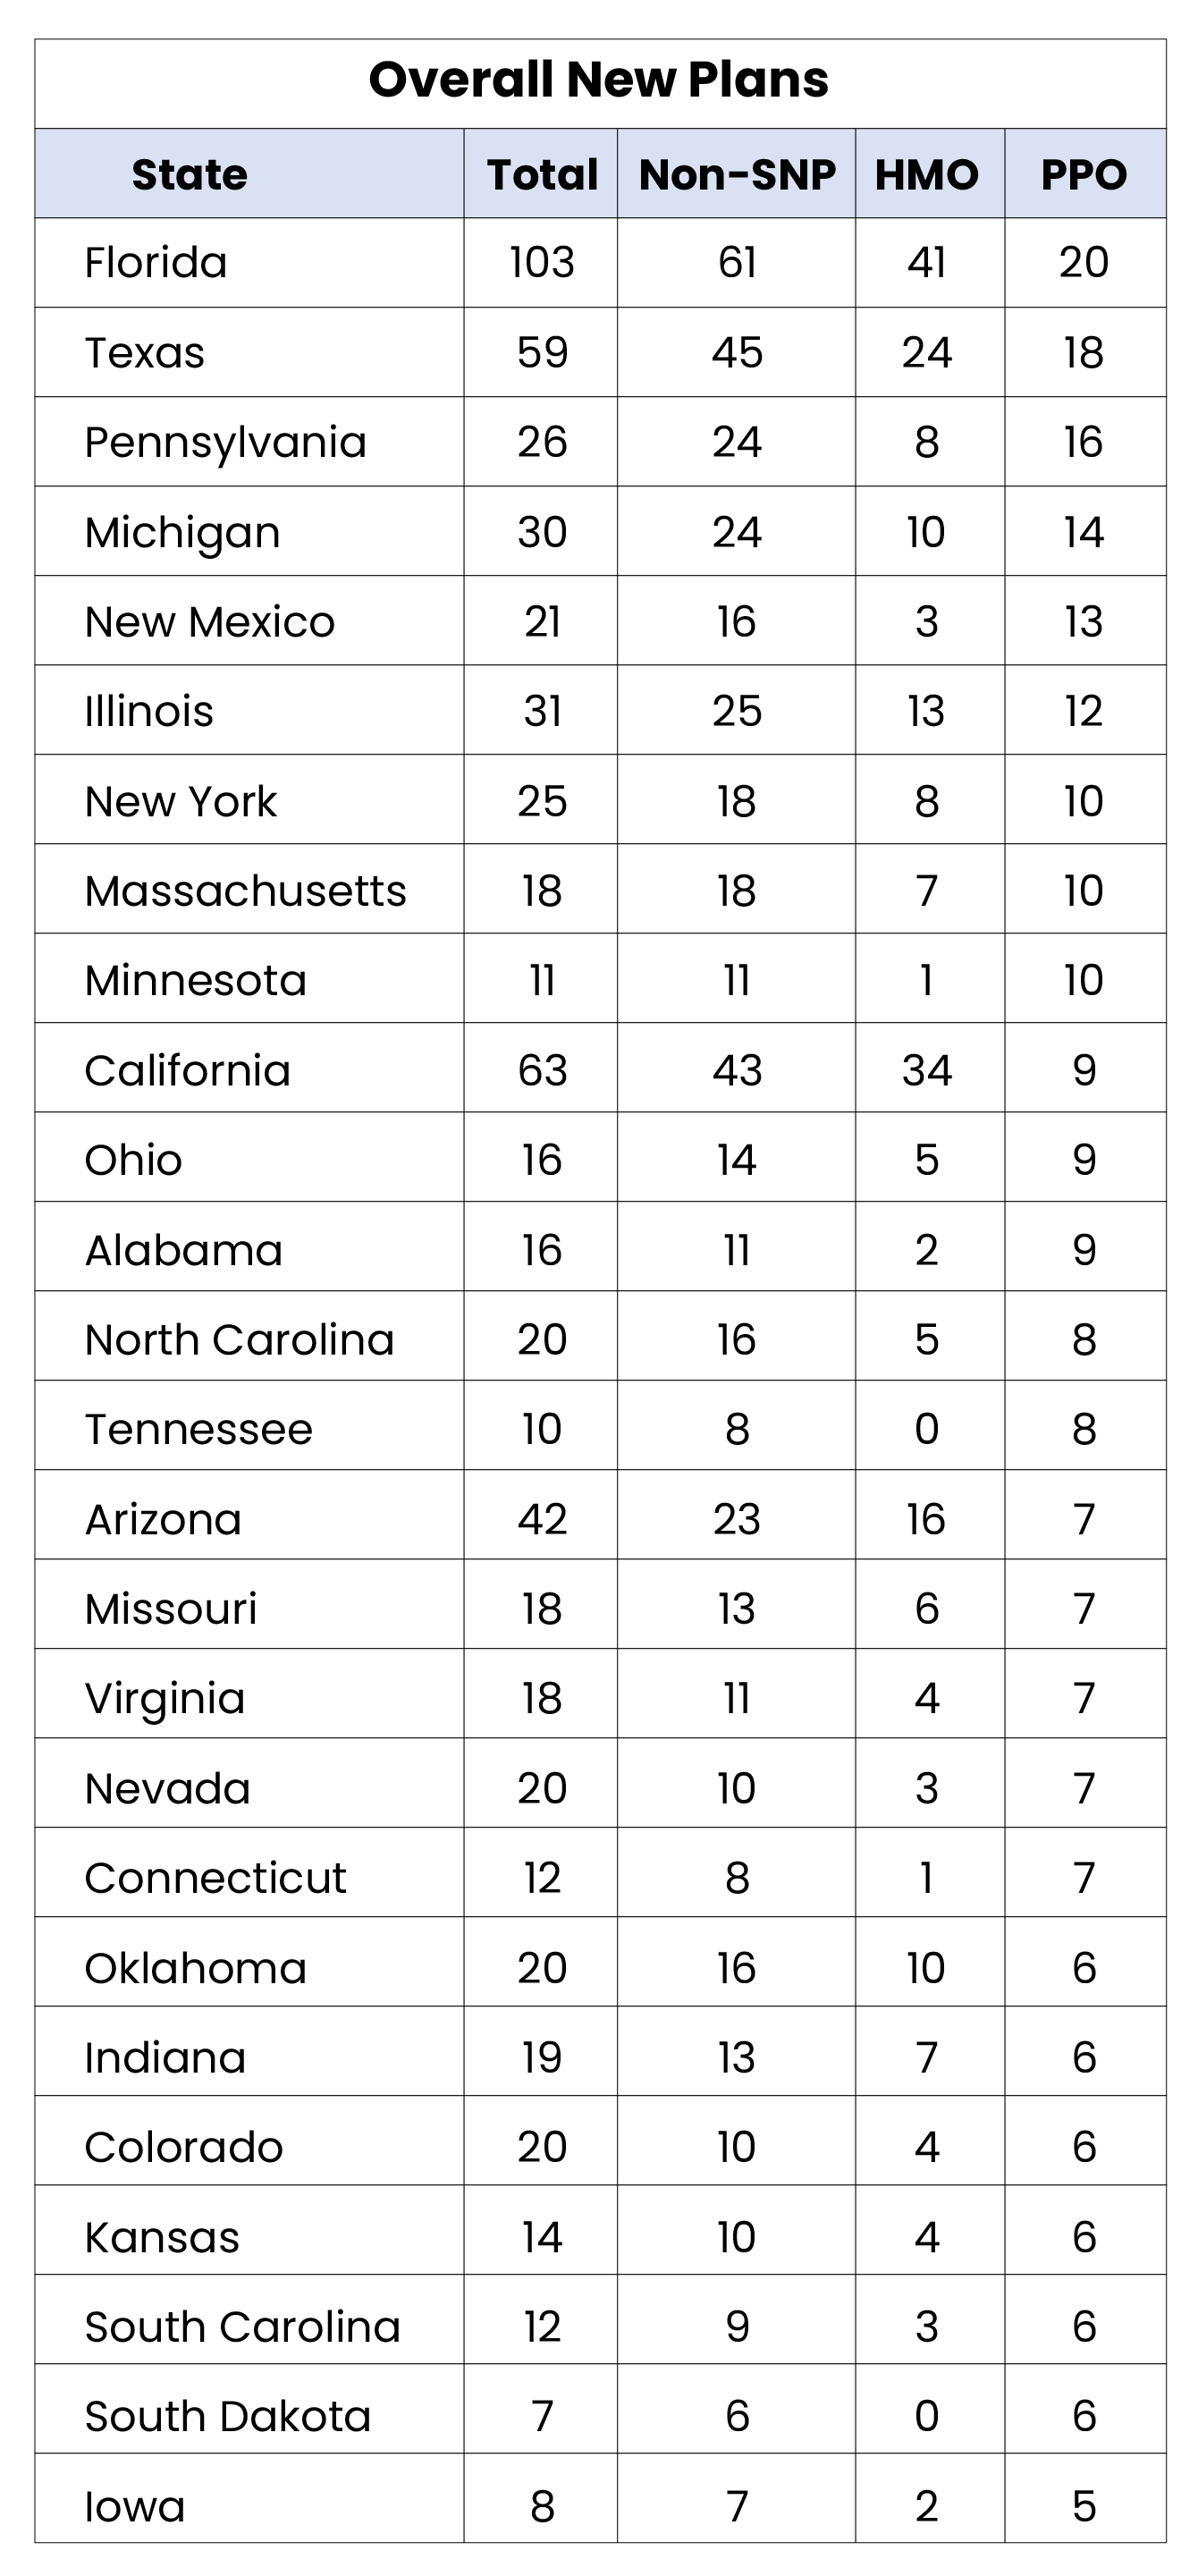
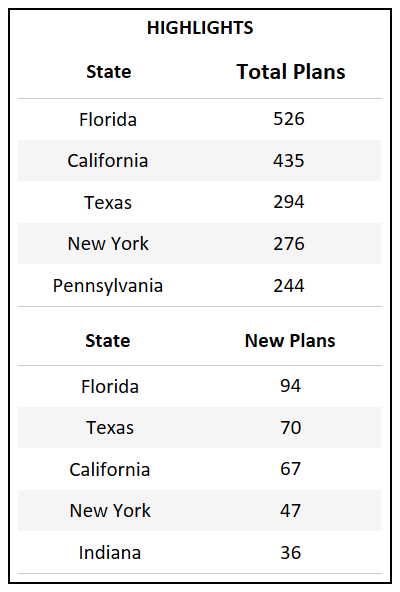
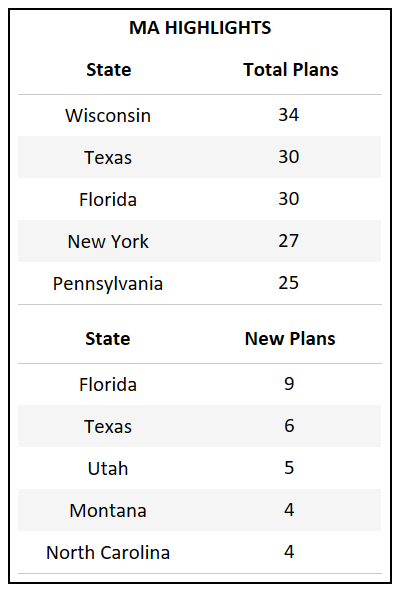
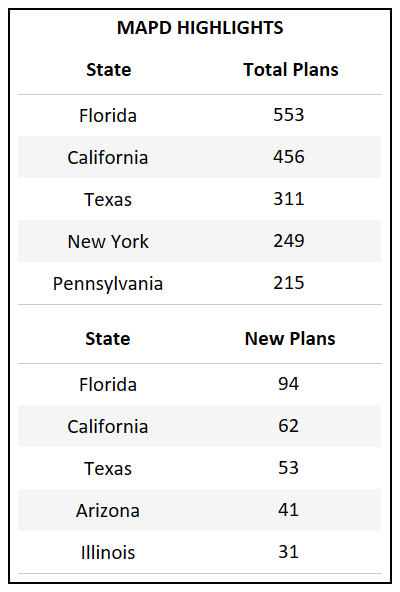
- Florida, which has the highest total count of Bid IDs in the country, also introduced the highest number of new plans for 2022.
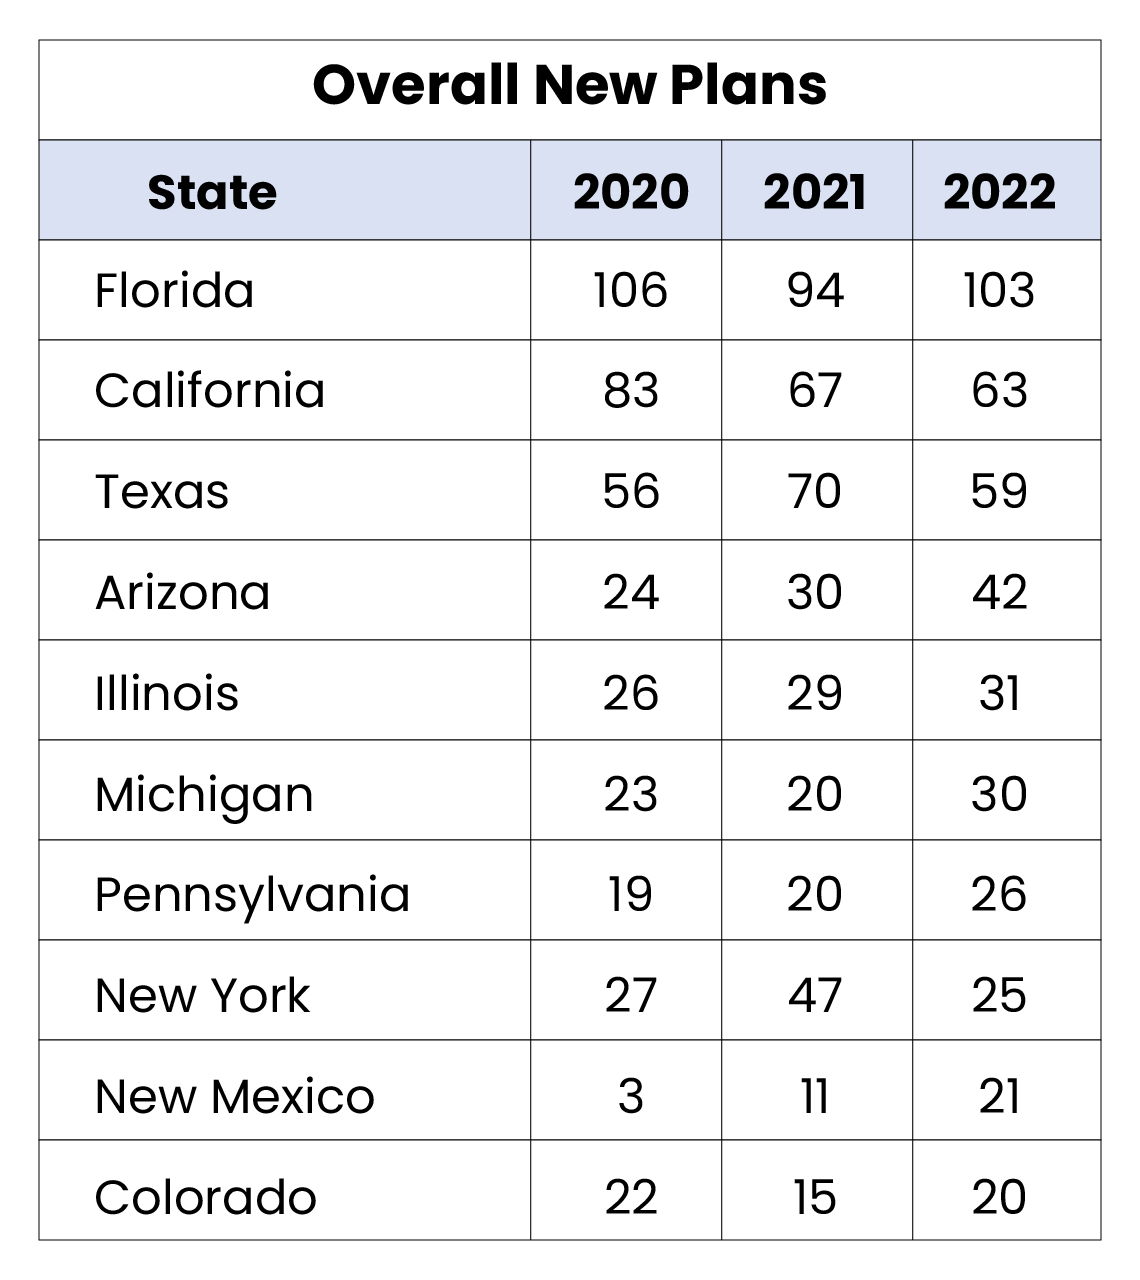
- For the third year in a row Florida, California, and Texas continue to introduce the highest number of new plans, accounting for the growth of their respective markets.
State Overview
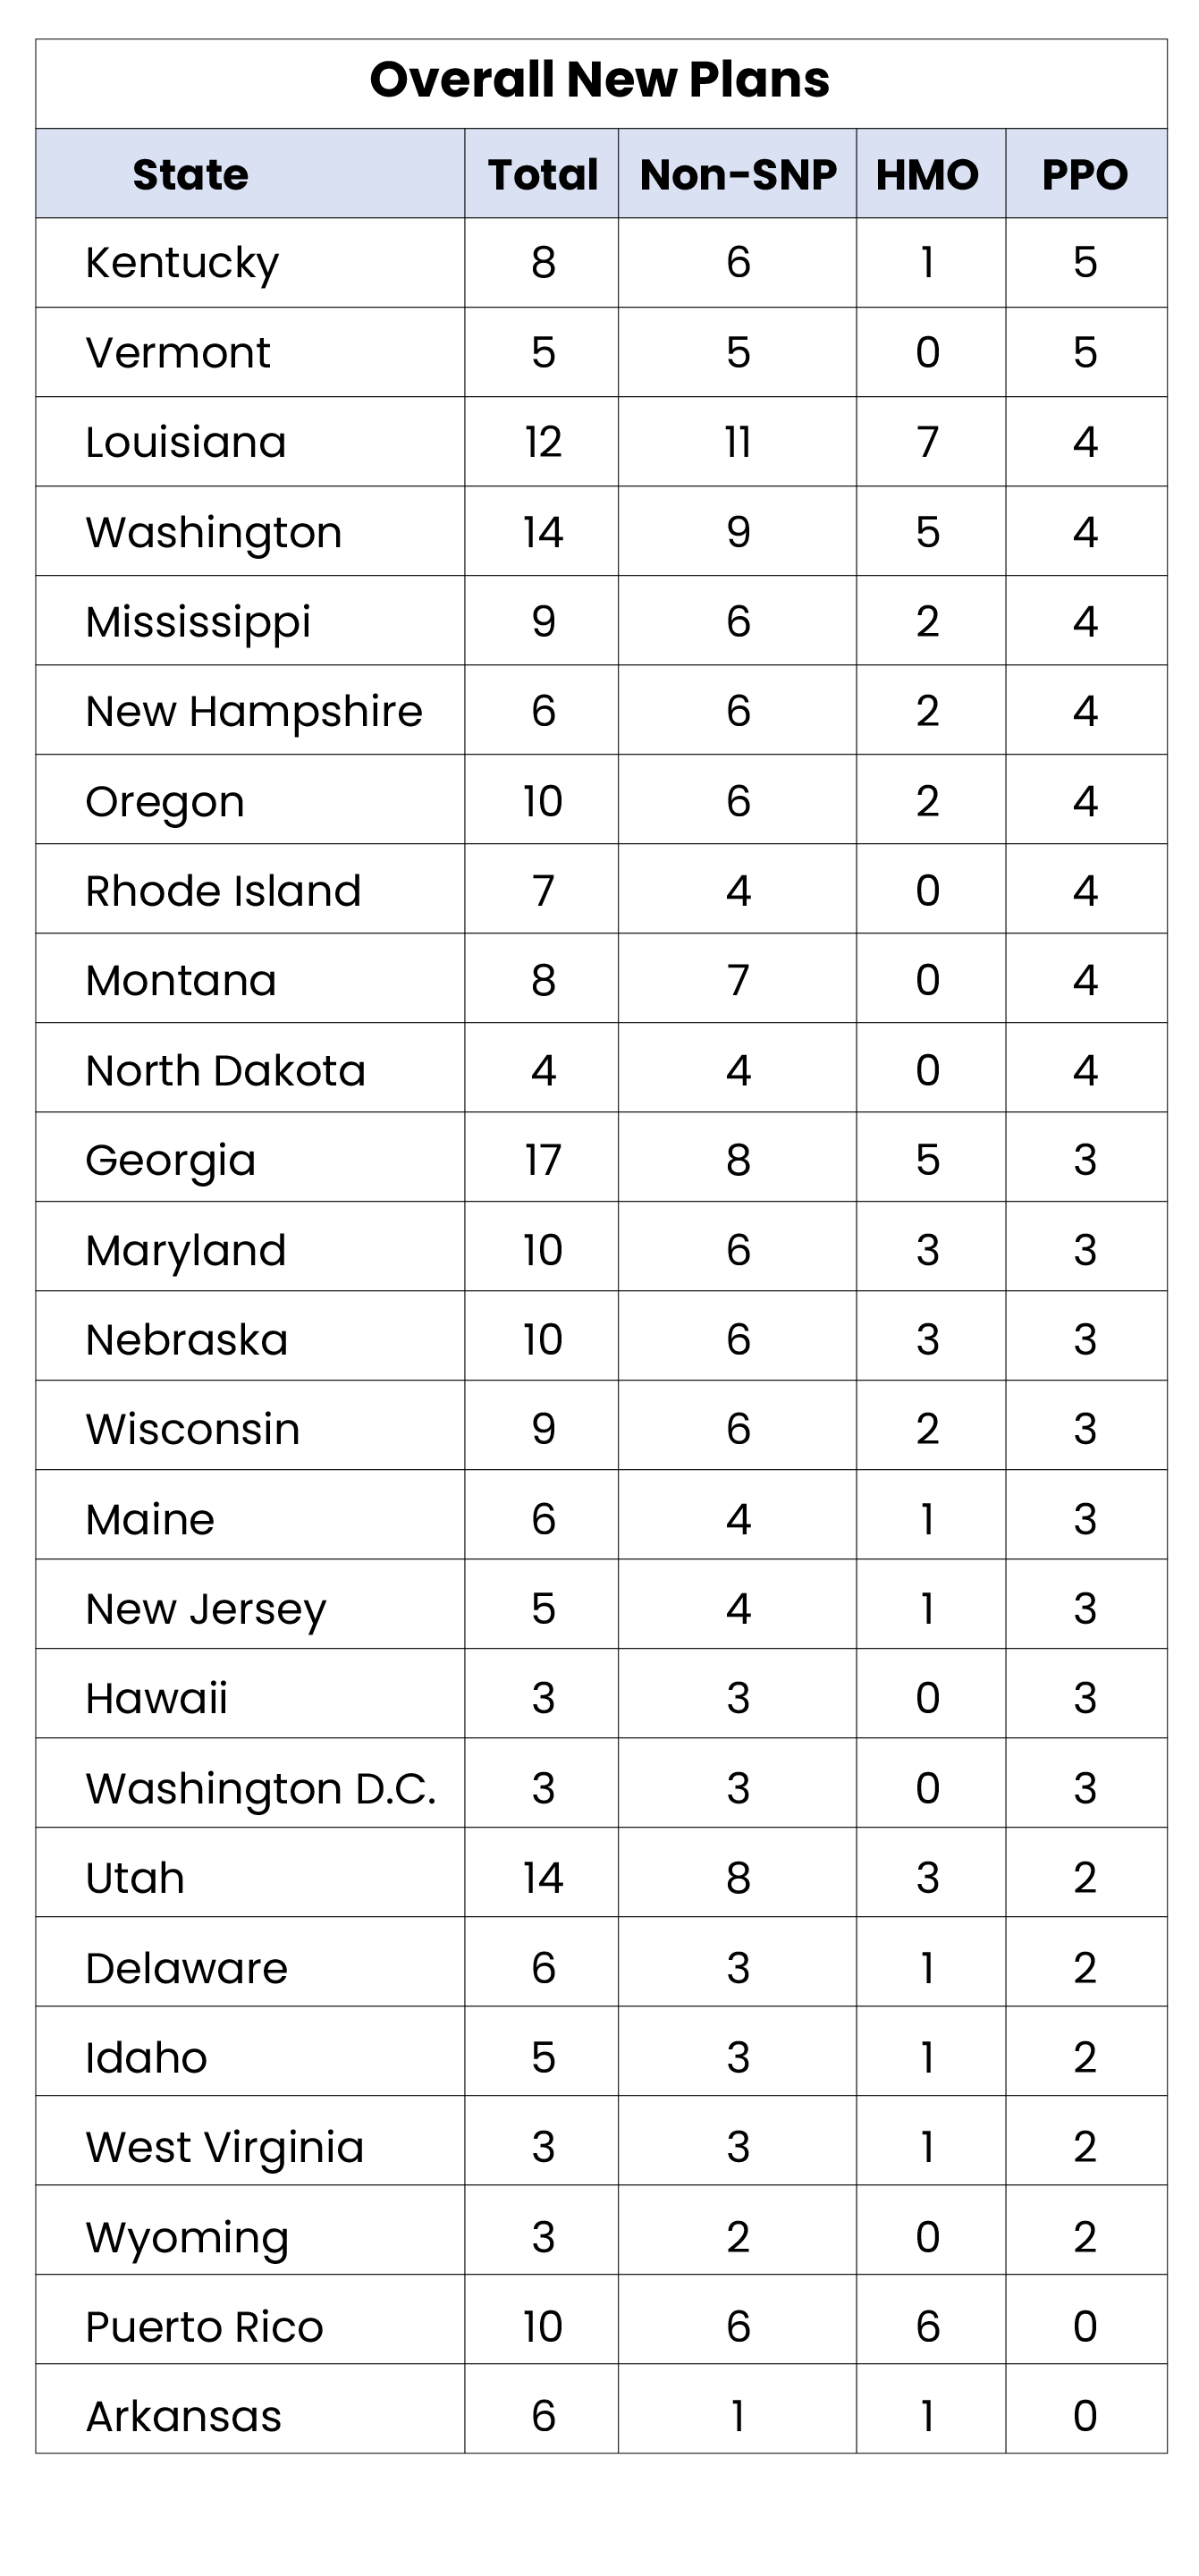
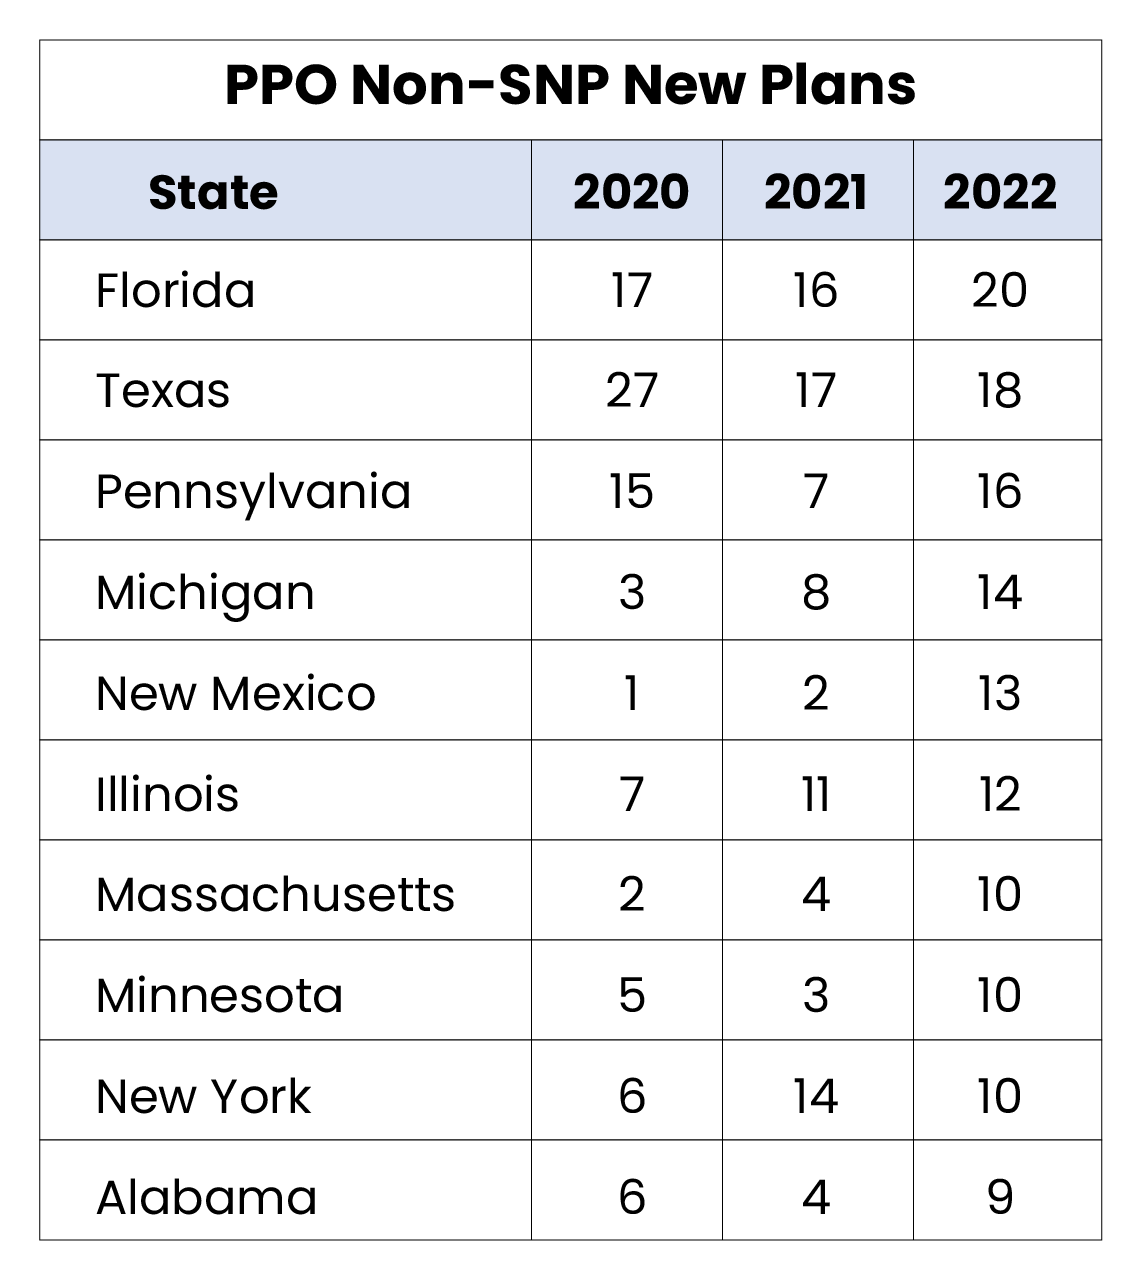
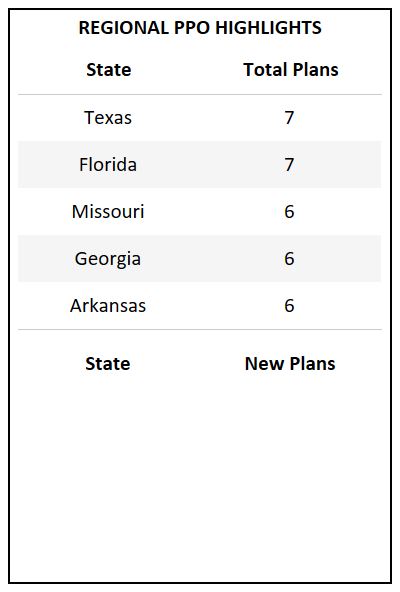
- Puerto Rico and Arkansas are the only states that did not have a new PPO plan introduced in 2022. (Full table in glossary)
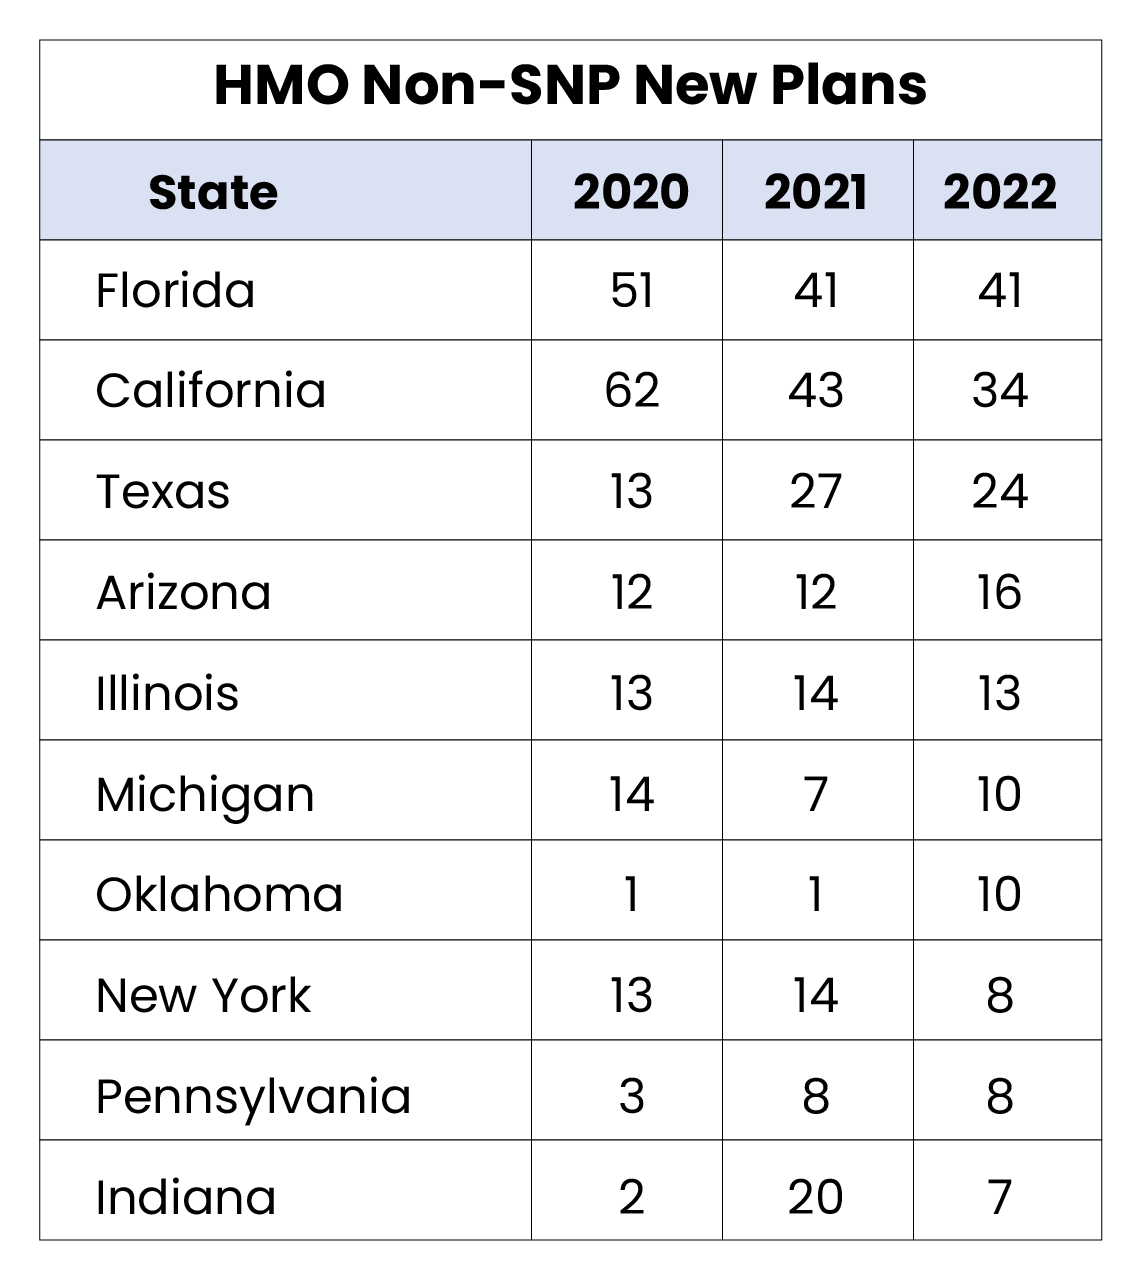
- Even with the rise of the PPO segment at a national level, certain markets, such as California, continue to see a higher increase in HMO offerings, with significant more new plans added.
- Pennsylvania, Michigan, and New York, each possessing a large percentage of Medicare eligibles, saw more PPO plans added in 2022 than HMO. Historical trends indicate that these major states typically serve as a national indicator on market shifts.

MA/MAPD Overview
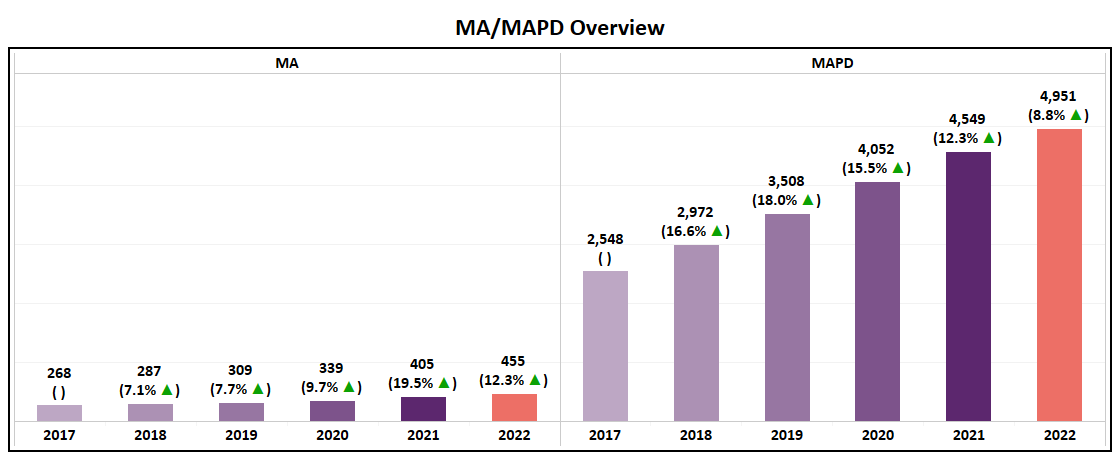
- With a nearly 9% increase, MAPD saw a rise of 402 plans while MA Only plans saw an increase of only 50.
- For the second year in a row the absolute number MAPD plan growth has fallen (2020 grew by 544 plans; 2021 grew by 497 plans; 2022 grew by 402 plans), indicating that the market may reach saturation at the highest level.
- The number of new MA and MAPD plans is slightly lower than previous trends. However, the variation has little effect on their growth trends.
SNP Type Overview
- All SNP categories will have a net plan increase for the third year in a row.
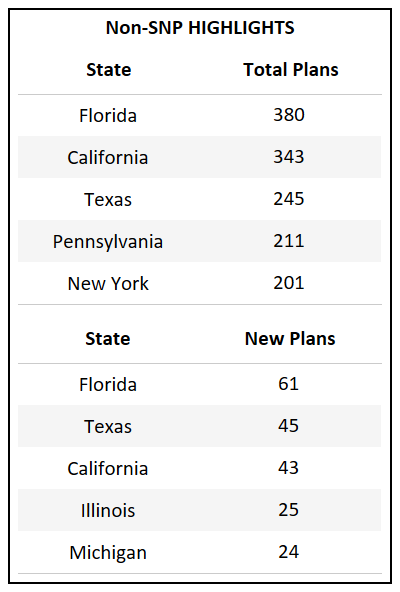
- A YoY net growth of 7% for non-SNP plans is the lowest in the past five years, over which the category has typically had an annual increase of 11-18%.
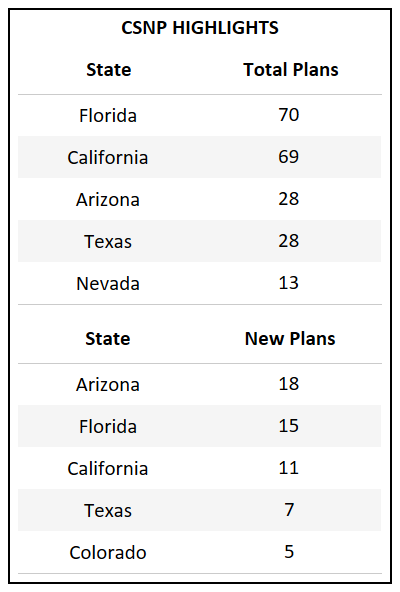
- CSNP, which will consist of 283 plan options in 2022, has more than doubled in plans over the past 4 years

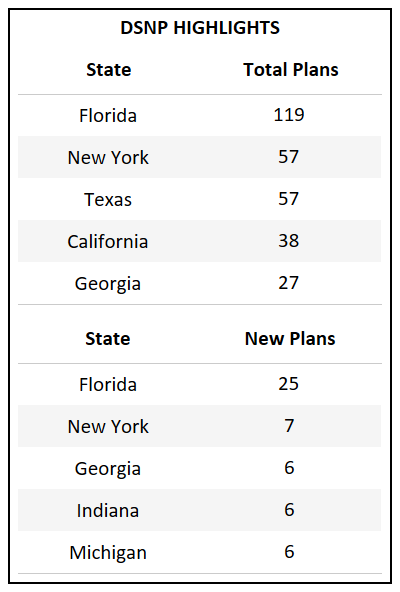
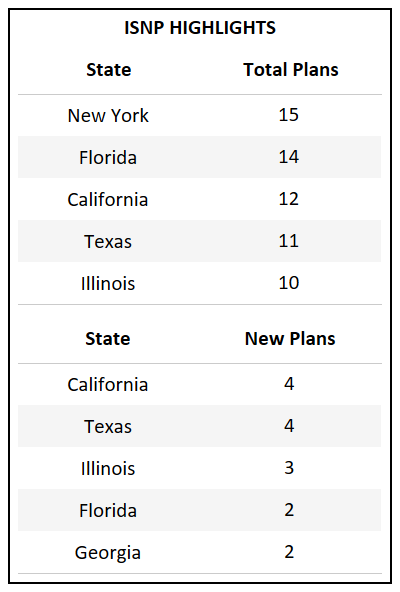
- CSNP and DSNP each saw an increase in the number of new plans introduced while ISNP and Non-SNP both saw a decline, each decreasing by ~17%.
- DSNP continues to grow at a rate of ~15% YoY, a trend that has continued now for 5 years.

Plan Type Overview (Non-SNP)
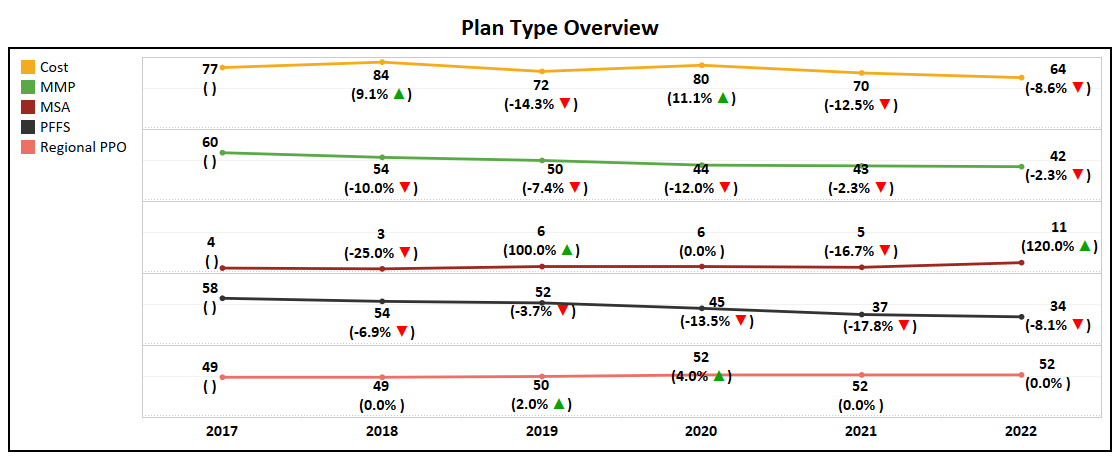
- Among Cost, MMP, MSA, PFFS, and Regional PPO, MSA is the only plan type to see growth while the rest have either dropped or remained stagnant.
- Both HMO and Local PPO grew in net plans, and while Local PPO has grown according to the trend, HMO may be entering a plateau.
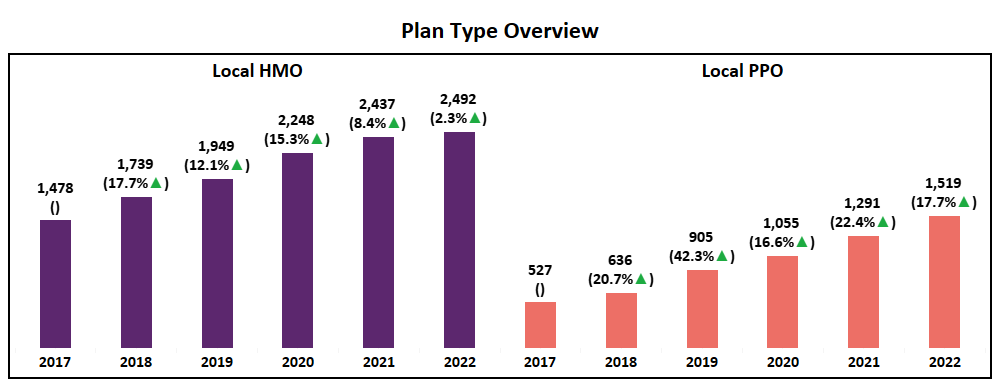
- 2022 marks the first time since this analysis began (2017) that the market will see more Local PPO plans introduced nationally than HMO. A major market shift and an indication that Payors are following the trend of consumer preference in which PPO enrollments have increased dramatically over the past few years.

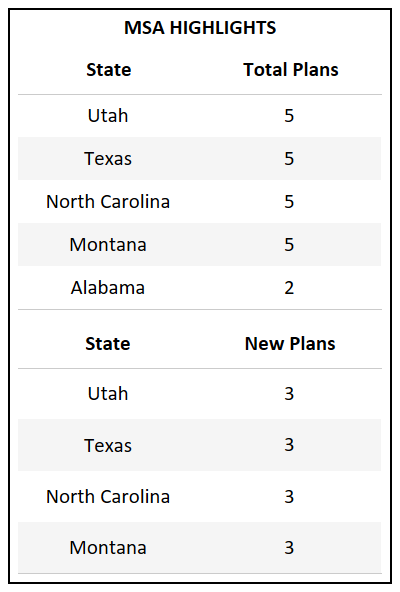
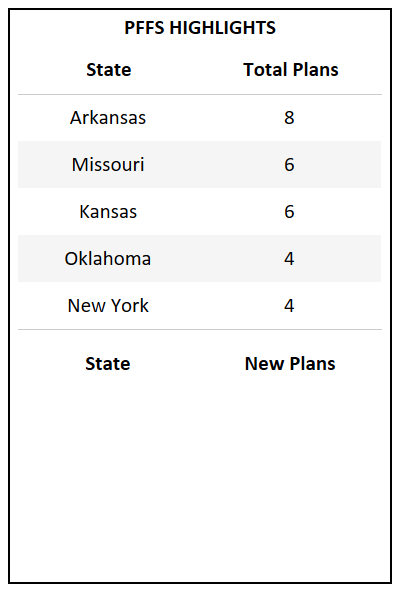
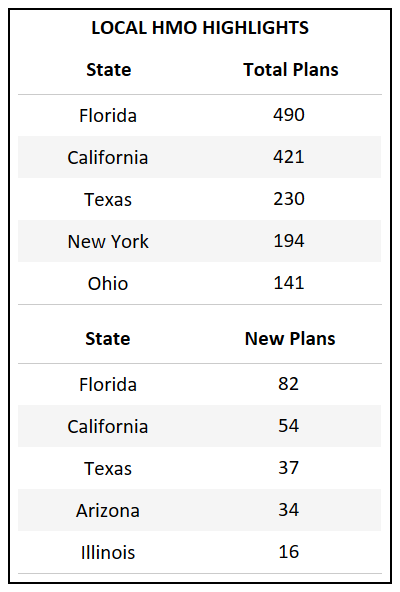
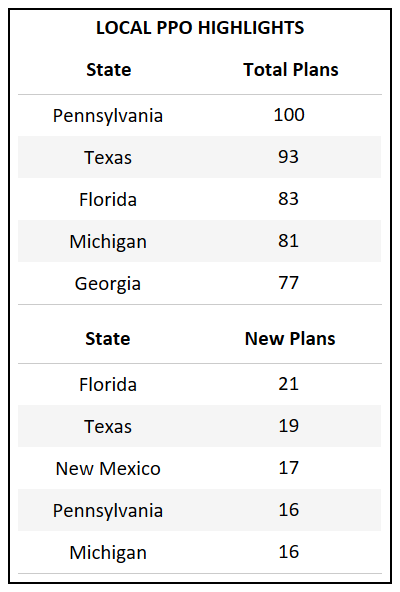
HMO and PPO Deep Dive (Non-SNP)
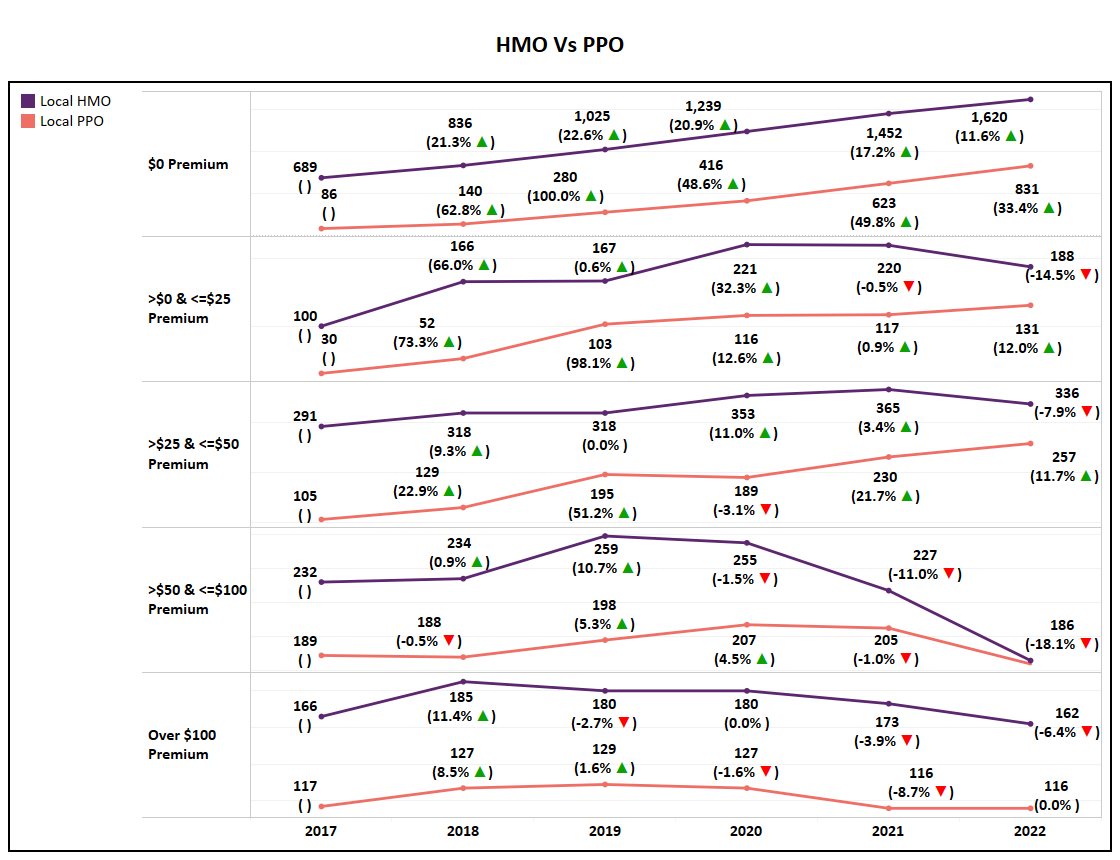
- The zero-dollar premium segment of HMO is the only to see growth in total plans for 2022, with all other HMO premium segments declining YoY. This further demonstrates the significance of zero-dollar premium options in the market, matching enrollment trends of the past few years.
- While zero & low premium Local PPO plans (<$50) will see an increase in plan totals for 2022, higher premium segments will see a decrease or flatline in the number of plans, with the $50 - $100 segment realizing a 18% drop.
- The significant growth of lower premium segments, driven by zero-dollar plans, is also evident in the YoY decline of Average Premiums.
Premium
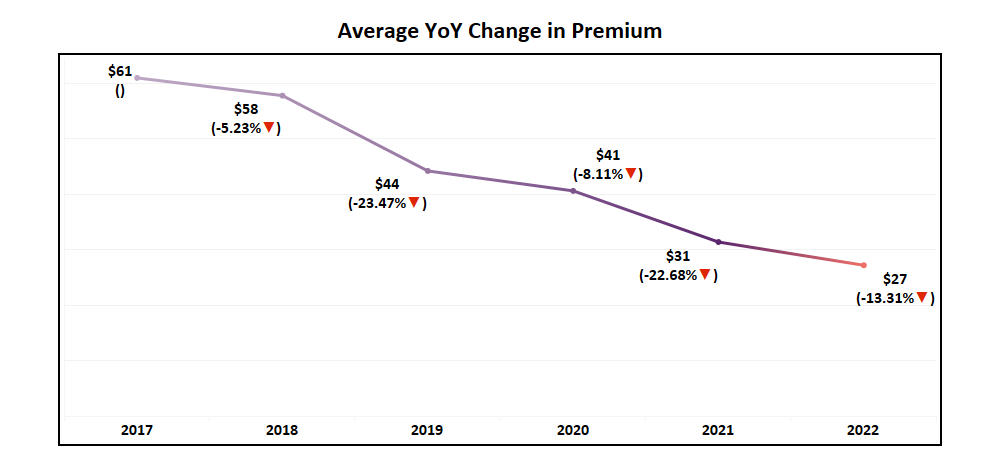
- Dropping 13.3% year-over-year, the average premium for 2022 Medicare Advantage Non-SNP plans hits at a low of $27, down from $61 in 2017. That is nearly a 56% reduction over the five years.
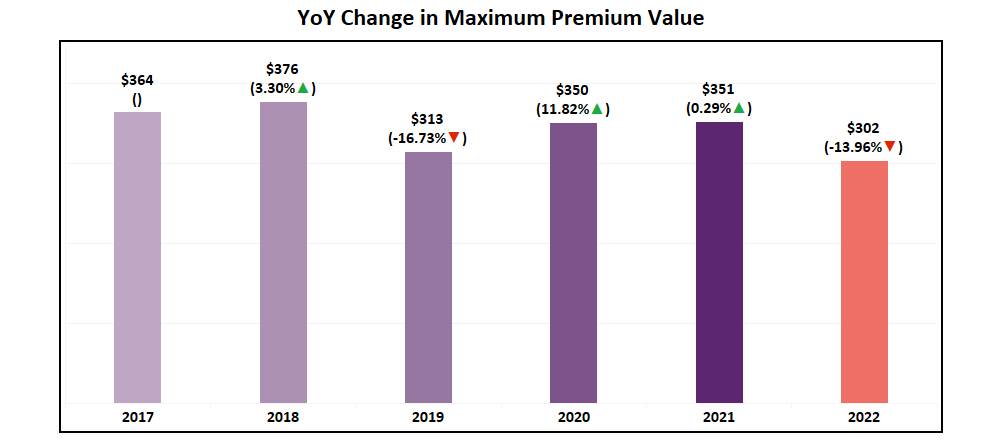
- One important factor influencing this continued slide in average premium is a 14% decrease in the max premium value (the highest premium plan available). Down from $351 in 2021, the highest Non-SNP premium plan available in 2022 will be $302.
- This drop, combined with an increased number of $0 plans being introduced, shows the continues maturation of plan premiums and continues to emphasize effective and efficient benefit design.

- All Non-SNP premium segments saw a reduction in the total number of plans available, except $0 Premium plans, which saw their total increase by 18%.
- Totaling 2,530 plans in 2022, $0 premium plans now account for 60% of all Non-SNP MA plans.
- Of all new plans introduced in 2022, 78% are $0 Premium, with 446 options added to the market. In perspective, only 125 non-zero plans are being introduced, with the majority (80%) of those being <$50.

Zero Premium Expansion
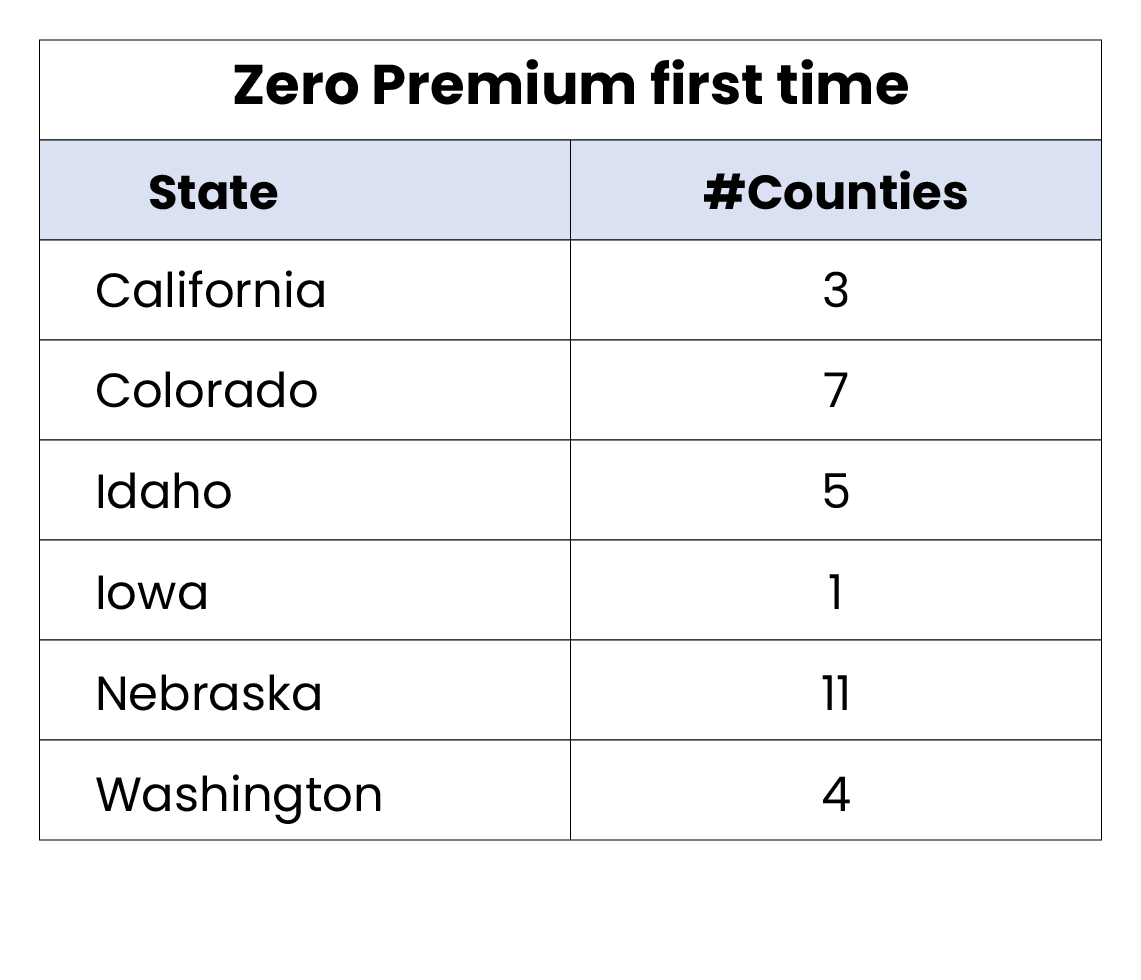
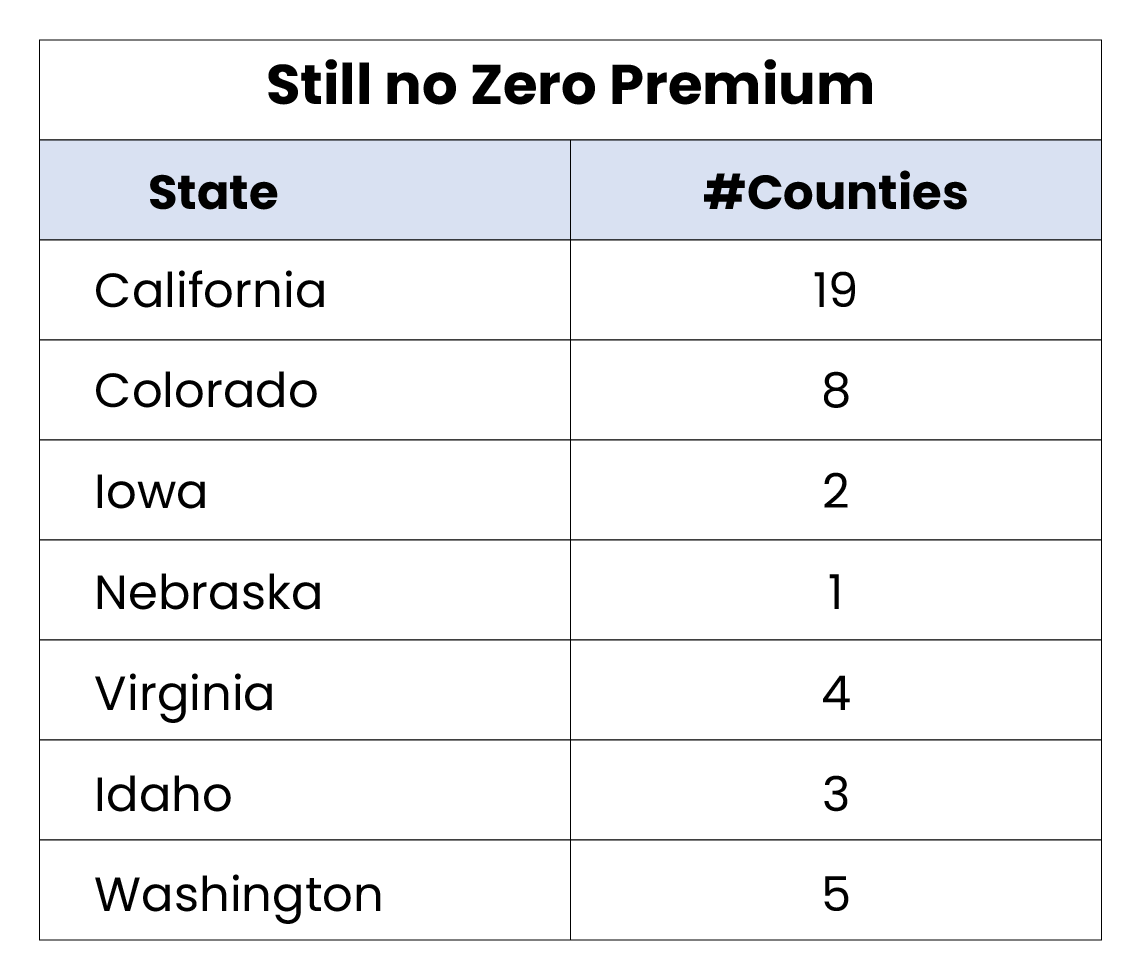
- Though zero-dollar premium plans are dominating the national market, there exists a small number of markets across the country (42 counties) which lack zero-premium option for consumers.
- In 2022, 31 counties across 6 states saw the introduction of zero-premium for the first-time, increasing options for over 126,000 Medicare eligibles.
- The remaining 42 counties without zero-premium plan options represents a TAM of over 500,000 Medicare eligibles.
Drug Deductible
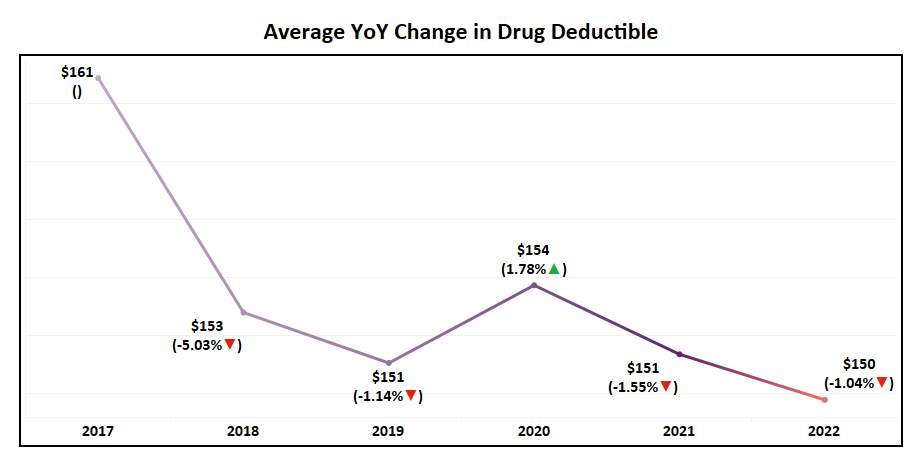
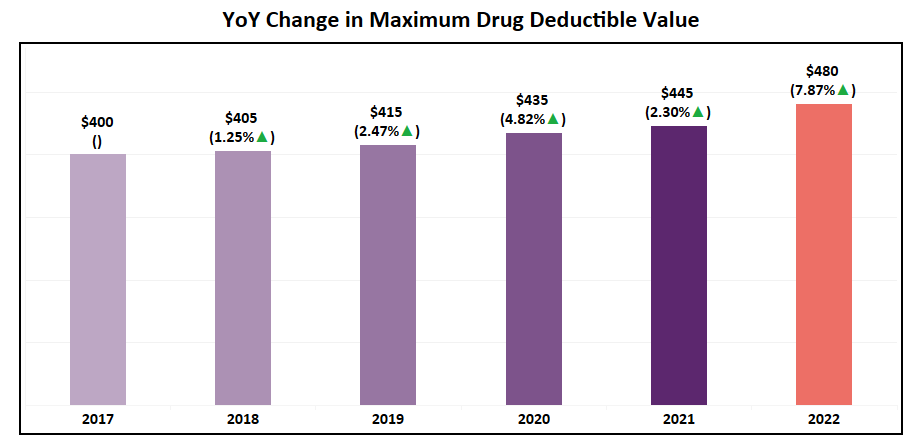
- The maximum drug deductible for MA Non-SNP plans has increased by 8% in 2022 to $480 while the national average has remained constant, having only a slight decrease of 1%.
- Though the zero-dollar deductible was the only to see a net increase in plans for 2022, the highest drug deductible segment (>$100) continues to hold its position as the second largest segment. As a result, the market is basically split between the two contrasting options.
- The annual drug deductible for MA Non-SNP plans pushed heavily toward $0 offerings in 2022. Only the zero-dollar segment experienced growth while all other segments saw a decline in total offerings for the first time in 6 years.

- This shift is even more evident when evaluating new plans for 2022 where 285 (57% of the total) were introduced with a zero-dollar drug deductible.
- Aside from 20 new plans offering a mid-range drug deductible, the remaining 198 (39% of the total) for 2022 are positioned in the >$100 segment, a YoY decrease of 27%. This includes 54 plans (27% of that highest segment) that opted for the CMS Maximum Allowable Deductible of $480.

In Network MOOP
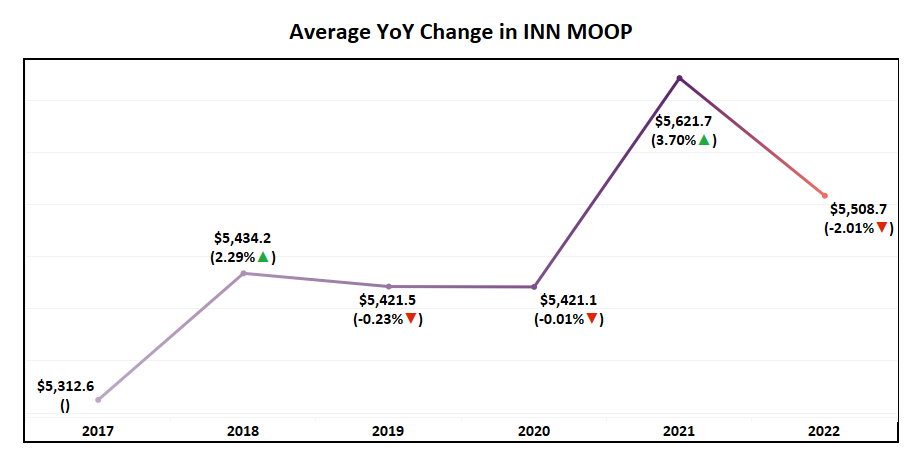
- The average MOOP, however, has fallen from last year by 2% to ~$5,500. As evident by the graph, average MOOP has failed to show a consistent trend and displays as one of the most volatile plan features YoY.
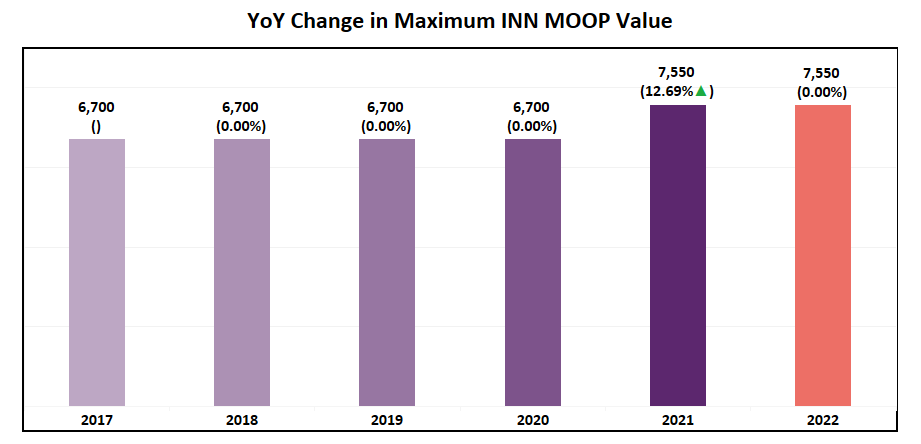
- The highest Maximum Out of Pocket (MOOP) value had no change and remains $7,550 in 2022.
- All segments of MOOP saw an increase in plans, but the >$3,000 segment saw the highest growth as per trend.

- Nearly 87% of all new plans introduced in 2022 will have a MOOP of over $3,000.

Benefit Overview (Non-SNP)
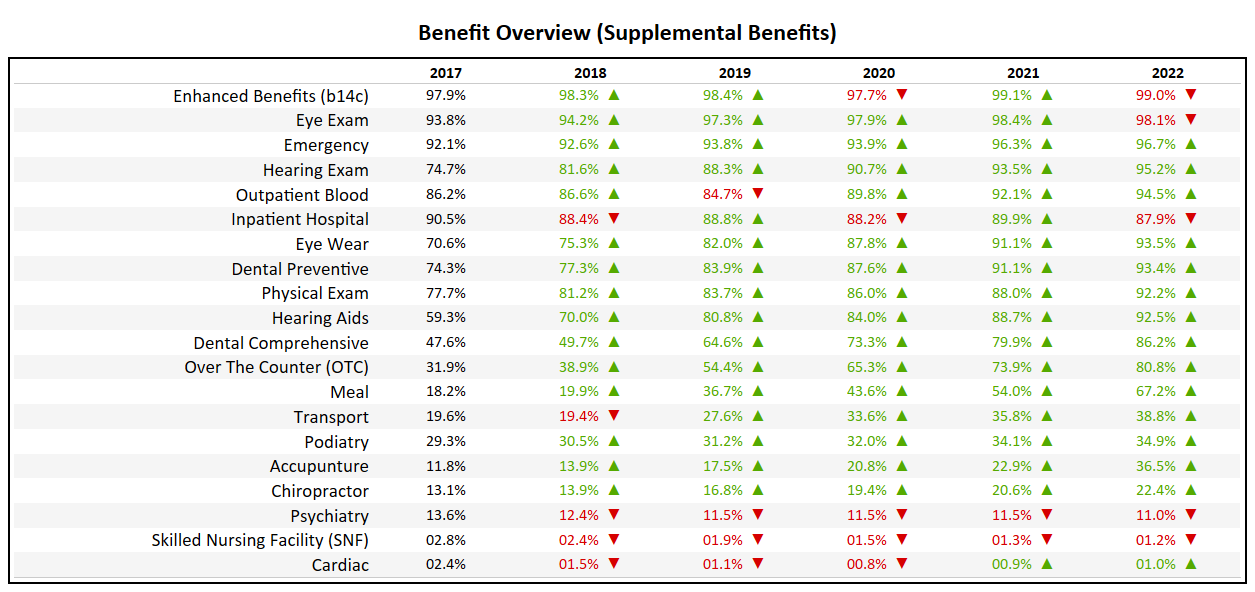
- The Over-the-Counter (OTC) benefit, which had been included in less than 40% of plans in 2018, is the fastest growing benefit in terms of inclusion, now available in over 80% of plans.
- Dental Comprehensive is now present in 86% of plans, up from 47% in 2017.
- The Meal benefit, which was relatively sparse (18.2% in 2017) will now be an attribute of 67% of Non-SNP plans in 2022.
- Physical Exam and Hearing Aid benefits will be present in over 90% of plans for 2022, a milestone mark which is typically used to identify a “Table Stakes” benefit.
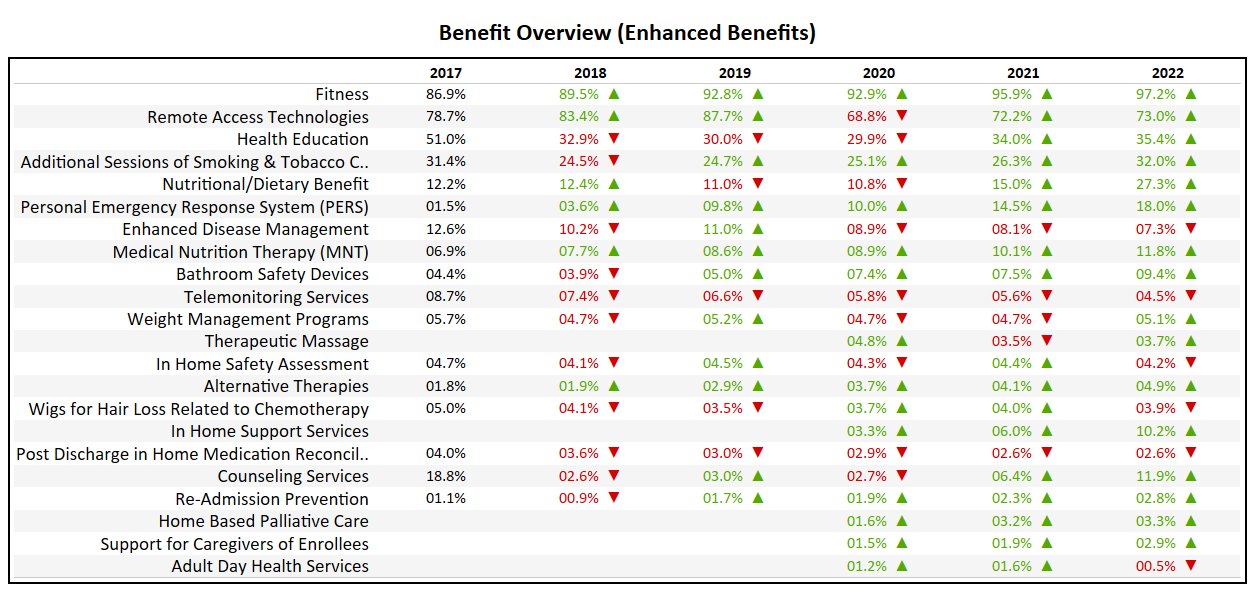
- At 97%, up 2% from 2021, nearly every Non-SNP plan in the market includes some form of a Fitness benefit.
- The Nutritional/Dietary Benefit has seen a major jump from 15% in 2021 to 27% in 2022. A major change in direction for a benefit which had been on a two year decline going into 2021.
- Telemonitoring Services, which many thought would see an increase during COVID, continues to decline in popularity, now present in only 4.5% of plans.
Major Expansions
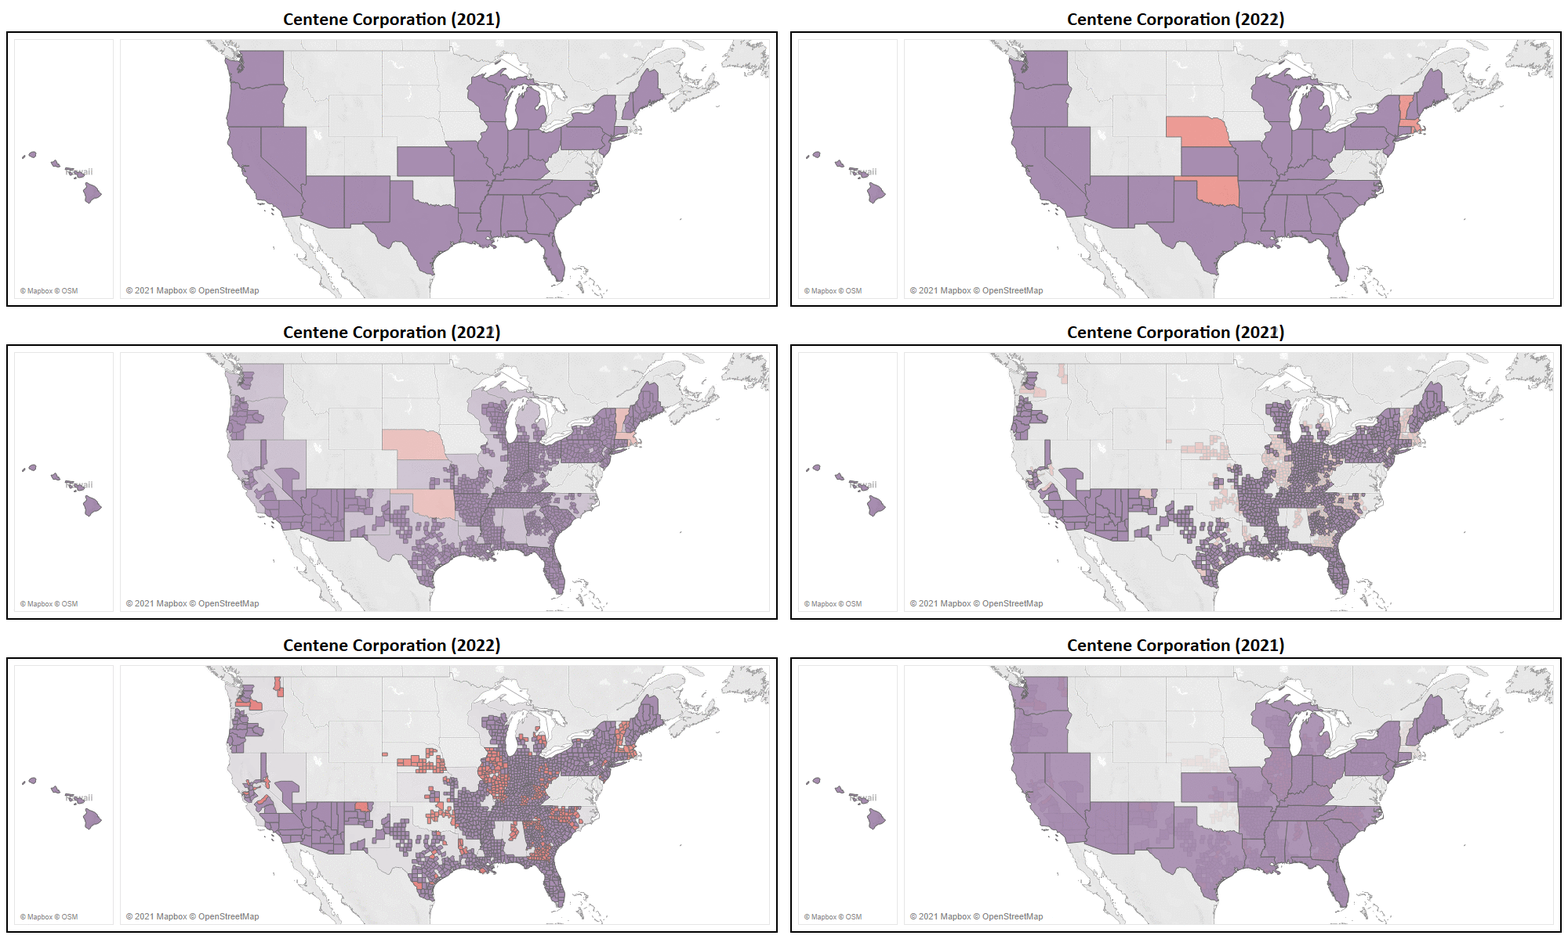
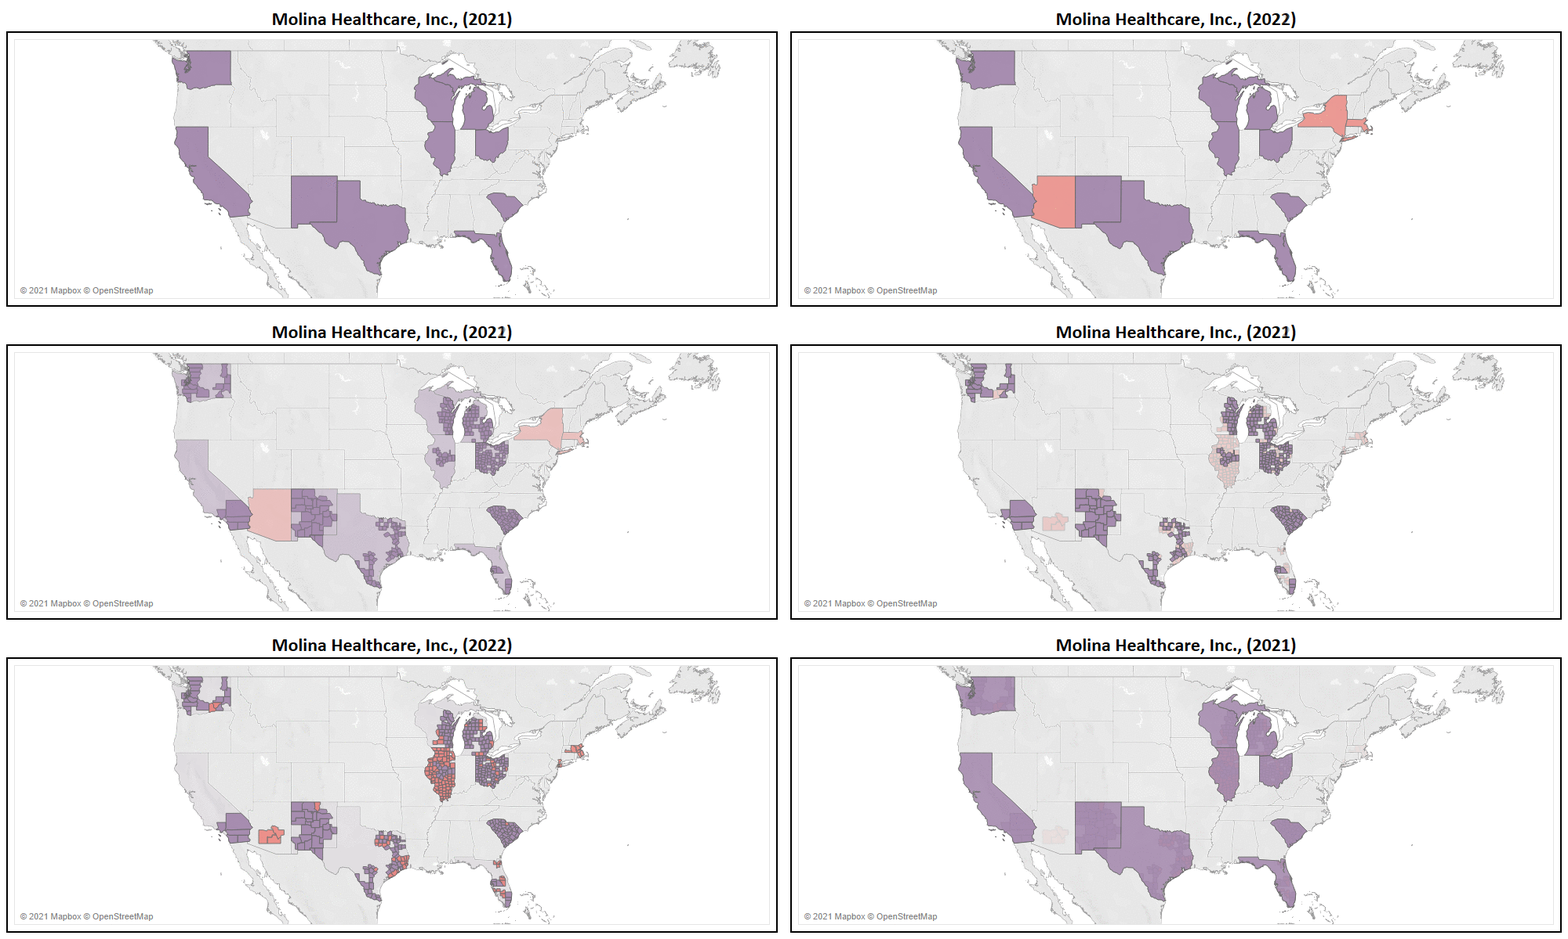
Many Medicare Advantage organizations, both large and small, focus heavily on market expansion as their catalyst for growth. With long term growth being at the forefront of every organization, two Payors, Centene Corporation and Molina Healthcare are seen as the most aggressive.
- Centene has entered the multiple new states in 2022, including Massachusetts, Nebraska, Oklahoma, Rhode Island, & Vermont.
- In addition to new states, Centene added a total of 361 new counties to their service area, representing a 29% expansion YoY (now in 1,597 nationwide).
- They have introduced 122 new plans for 2022, of which 79% of which are Non-SNP.
- With this service area expansion, Centene increased their total addressable market (TAM) to 48 million Medicare eligibles, a ~14% increase YoY.
- Molina, second to only Centene in terms of expansion, added Arizona, Massachusetts, New York, & Virginia in 2022.
- With a total of 287 new counties added to their service area, Molina expanded their market by 85% YoY (now in 623 nationwide).
- Molina will introduce 22 new plans for 2022, of which only 64% are Non-SNP. This nearly doubles their Non-SNP plan total to 24.
- With their service area expansion, Molina has increased their TAM to 24 million Medicare eligibles, a ~57% growth YoY.
Glossary
