Demystifying
Medicare Advantage
Significance of benefits and other factors on enrollment gain
December 13, 2021 Whitepaper
Multiple factors come together to form a successful plan. While some factors strongly correlate to net enrollment gains, other factors serve as a value add to make plans more attractive to beneficiaries. Therefore, identifying these factors and correctly basing them as Significant or Insignificant factor is crucial in designing attractive plans and improving enrollment gains.
The various attributes have been segmented into three levels –
- Significant – Important factor in any given region which have a high correlation with enrollment gain.
- Insignificant – Factor that has low correlation with enrollment gains but can be used as a value add to improve plans.
- Table Stakes – Benefits present in nearly all the existing plans. Can be considered the bare minimum a plan must offer to be regarded as a competitive plan.
Scope –
This study focuses on Non-SNP, MAPD plans for HMO & PPO Plan Types.
Methodology –
The results of this study were derived from a combination of black box and explainable AI (xAI) models. Random forest, neural networks, and multiple regression, along with regularization techniques like Lasso and Ridge regression, were some of the methodologies used to develop the significance bucketing AI/ML models. The results of these complex algorithms were then used as inputs for xAI methodologies such as LIME (Local Interpretable Model Agnostic Explanations). Finally, the results were verified using a sound business understanding foundation.
Fifty-four factors comprising of Original Medicare benefits, Optional benefits, and Cost & Other factors were used as inputs for the significance bucketing AI/ML models. While all 54 factors were segmented as Significant, Insignificant, or Table Stakes, this whitepaper focuses only on Optional benefits, and Cost & Other factors. With Original Medicare benefits being included in each plan irrespective of its significance towards net enrollment gain, those benefits were not considered in this analysis. However, evaluation of those benefits is equally important, and the influence is measured for the variables of the benefit, such as member cost, which was not considered in this whitepaper.
Results –
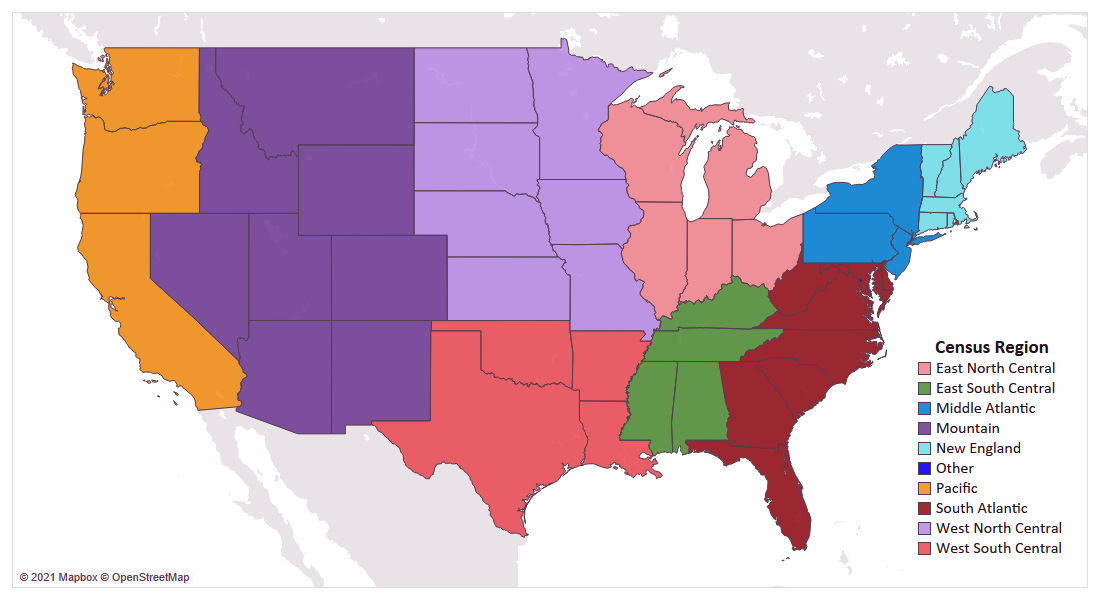
The results found below are the result of an in-depth, nationwide analysis of each factor, which have been rolled up to the nine census regions of the United States. Some factors are broken by plan type (HMO & PPO) to demonstrate how the significance, or influence of variables, can vary between the two segments, while other factors are shown at an overall level when the two had similar results.
Premium


Key Takeaways -
- Premium is one of the most important factors for both HMO and PPO plans.
- At a national level, and for most census regions, Premium presents as a Table Stake benefit with a clear preference for zero-dollar premium plans.
- For HMO plans, 3 regions – Middle Atlantic, New England, and Pacific have premium as Significant and not Table Stakes.
- Zero-dollar premium plans performed the best in both net enrollments and net enrollments per Bid ID.
- For PPO plans, only 2 regions, Mountain and Pacific, premium is Insignificant.
- In PPO, while zero-dollar premium plans performed the best, there are a few regions where the $1 to $20 premium range had a higher net enrollments per Bid ID.
Annual Drug Deductible


Key Takeaways -
- For HMO plans, at a national level and for most census regions, it is a Significant factor with a clear preference for zero-dollar drug deductible plans.
- Only 1 region in HMO, Middle Atlantic, has drug deductible as Insignificant.
- Zero-dollar drug deductible plans performed the best in terms of net enrollment, but in some regions, other buckets had better net enrollment per Bid ID.
- For PPO plans, at a national level and for most census regions, it is an Insignificant factor with no clear preference for any bucket.
- Only 4 regions in PPO have drug deductible as Significant.
- For PPO plans, at a national level, zero drug deductible has captured the highest net enrollment but multiple regions had non-zero drug deductible plans see higher net enrollment and net enrollment per Bid ID.
MOOP – Maximum Out of Pocket
Key Takeaways -
- For HMO plans, at a national level and for most census regions, MOOP is a Significant factor with $2,000 to $4,000 as the preferred level.
- Beneficiaries with HMO plans prefer a lower MOOP, with many regions have gained max net enrollments in the $2,000 to $4,000 range with a few regions have high net enrollments per Bid ID in the $0 to $2,000 range.
- The only outlier in HMO is the New England region, where the preference is towards $6,000+ MOOP.
- For PPO plans, at a national level the preference is towards the $6,000 plus range, but regional preferences vary from $4,000 to $6,000+.
- Thought beneficiaries with PPO plans accept a higher MOOP of $6,000+, multiple regions saw higher net enrollments per Bid ID in the $4,000 to $6,000 range.
- The only outlier in PPO is the West North Central region, where the preference is towards 2K to 4K range MOOP.
- The only outlier in PPO is the West North Central region, where the preference lands between $2,000 & $4,000.
Plan Type

Key Takeaways -
- Plan Type currently presents as Insignificant at the national level and for most regions but is predicted to become a significant factor within a couple years, favoring PPO.
- At a national level, Local PPO plans have outperformed HMO plans in both net enrollments and net enrollments per Bid ID.
- East South Central and Pacific are the only 2 regions where Local HMO outperformed Local PPO.
Drug Benefit Type


Key Takeaways -
- Enhanced Alternative is clearly the most preferred drug benefit type.
- With little to no plans or enrollments in the other drug benefit types its Insignificant as there is no variance in the data.
- While Defined Standard is the bare minimum a plan must provide, there is a clear preference from both payors and beneficiaries to have a more comprehensive drug benefit type.
Giveback

Key Takeaways -
- Very few plans offer giveback, making it extremely hard to measure the influence at a regional level.
- As giveback is offered across more plans, indications are that it will likely become significant in prominent markets, serving as a major point-of-difference for many Payors.
Star Rating

Key Takeaways -
- Generally speaking, plans with a star rating of 4 and higher gained most of the enrollments.
- A high number of enrollments went towards new plans with no star ratings, however, these plans are usually positioned competitively in the market, skewing the analysis of stars as a specific influencer.
Eye Wear


Key Takeaways -
- Eye wear is a Table Stakes across all regions.
- It has grown from being present in 71.6% of the plans in 2017 to being present in 92.4% of plans in 2021.
- No region saw showed significant enrollment growth in plans that do not offer eye wear.
- While the growth of eye wear may have slowed down in 2021, the benefit is trending towards a foundational benefit, available in most, if not all plans in the near future.
Emergency


Key Takeaways -
- Emergency is a Table Stakes across all regions.
- It was present in 95.4% of the plans in 2017 and is present in 97.5% of plans in 2021.
- Capturing over 95% enrollments in all the regions, the emergency benefit is one the most from a payor and beneficiary standpoint.
Eye Exam


Key Takeaways -
- Eye exam is a Table Stakes across all regions.
- Was present in 95.5% of the plans in 2017 and is present in 98.9% of plans in 2021.
- No region saw significant growth with plans that did not offer eye wear.
- Plans with eye exams have captured over 97% enrollments in all regions, indicating how critical it is from both a payor and beneficiary standpoint.
OTC – Over the counter


Key Takeaways -
- For HMO plans, OTC is a Table Stake at a national level and for most regions.
- Nearly every region saw a loss in HMO plans that failed to offer an OTC benefit.
- The annual allowance has grown by nearly $130 in 5 years, with the biggest jump seen in 2019.
- For PPO plans, OTC is Insignificant at a national level and for most regions.
- While PPO plans with an OTC benefit gained higher net enrollments, unlike HMO plans, plans without an OTC benefit also saw enrollment gains.
- The annual allowance has grown by nearly $110 in 5 years but is still lower than HMO plans by an avg of $60.
Hearing Aids

Key Takeaways -
- Hearing aid benefit is a Table Stakes across all regions.
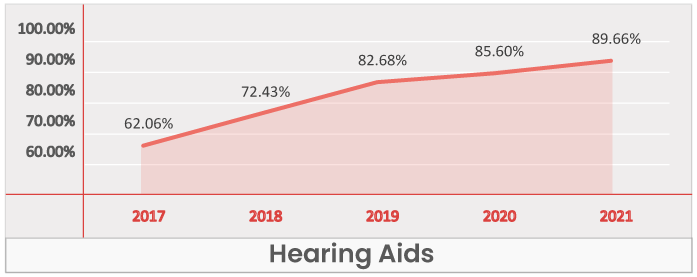
- It has grown by nearly 27% in the past five years, present in 62% of the plans in 2017, then increasing to 89.7% of plans in 2021.
- PPO plans in particular witness a strong inclusion growth from 43.7% in 2017 to 86.4% in 2021.
Preventive Dental


Key Takeaways -
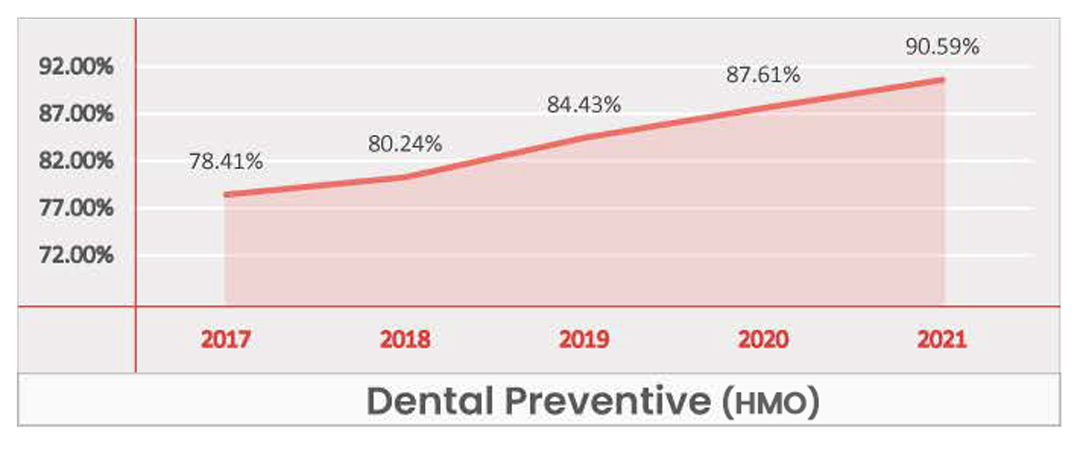
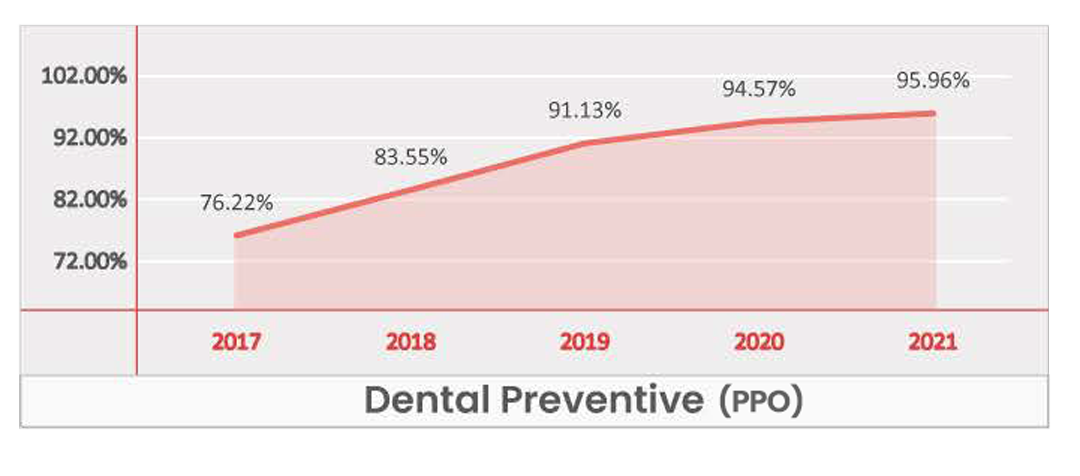
- While for most regions it is Table Stake, at a national level Dental Preventative presents as a Significant benefit for HMO plans and a Table Stake for PPO plans.
- Dental Preventative presents as Insignificant in Middle Atlantic because HMO plans with and without the benefit saw loss in enrollments in recent years.
- No region showed significant growth in enrollments when preventive dental was not offered.
- Pacific and Mountain are the only 2 regions for PPO where plans without preventive dental have seen any positive enrollment growth.
- As of 2021, Dental Preventive is present in over 95% of PPO plans, and based on the current trend, it will be available in nearly all plans within the next few years.
Comprehensive Dental


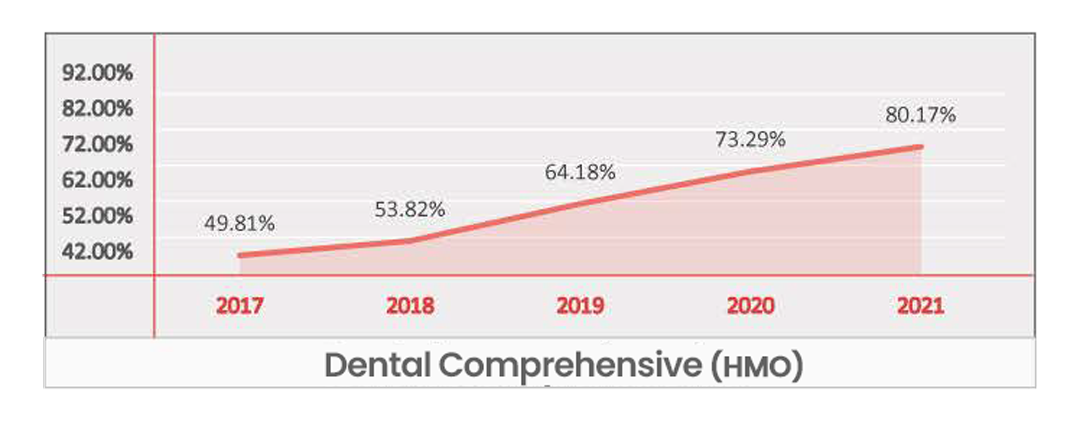
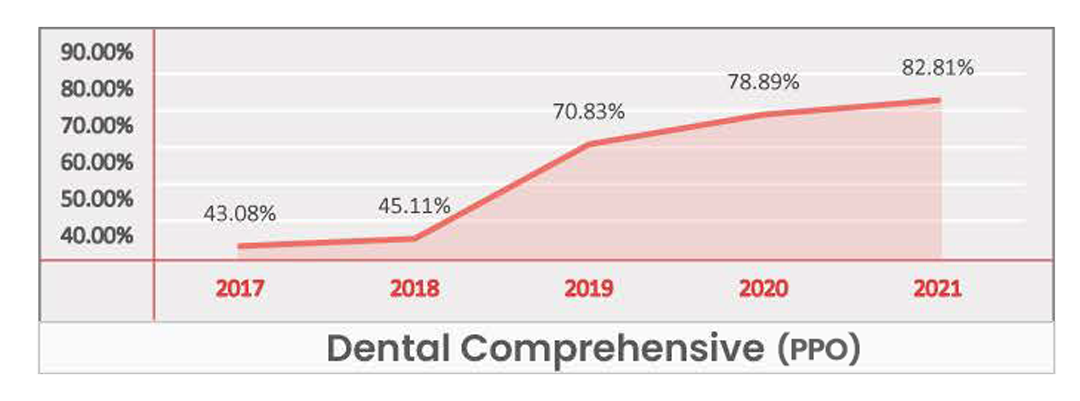
Key Takeaways -
- Identified as a Significant Benefit at a national level and for most regions.
- East North Central is the only region for HMO where plans without Dental Comprehensive have captured enrollments of approximately 12,000.
- Other than East North Central & South Atlantic, every region saw plans without Dental Comprehensive lose enrollments for HMO.
- Given the current growth rate, Dental Comprehensive is set to become a Table Stake nationwide within the next two years.
- Pacific is the only region where PPO plans without Dental Comprehensive have captured net enrollments of approximately 17,000.
- Pacific and South Atlantic are the only 2 regions for PPO where Dental Comprehensive is identified as Insignificant.
- In the Pacific region, where this benefit is identified as Insignificant for PPO plans, the plans offering Dental Comprehensive captured most of the enrollments while plans without captured much less, totaling nearly 30% of the net enrollments.
- Insignificance in South Atlantic indicates that beneficiaries do not put too much emphasis on the inclusion of Dental Comprehensive when purchasing a PPO plan.
Meals

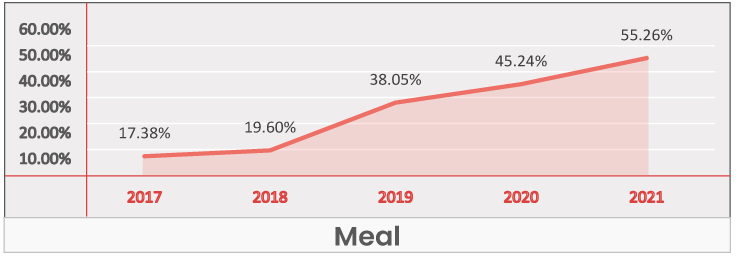
Key Takeaways -
- At a national level and for most regions, the Meal benefit is identified as being Insignificant in its influence on enrollment gain.
- The only outlier is East South Central where Meals is identified as Table Stakes due to its high plan inclusion rate.
Transportation

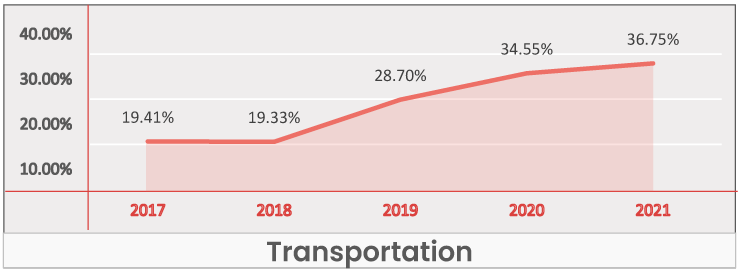
Key Takeaways -
- At a national level and across regions it’s identified as an Insignificant benefit.
- In most regions the Transportation benefit is not an identifiable driver of enrollments, but instead is included as a value add or point of differentiation.
Acupuncture

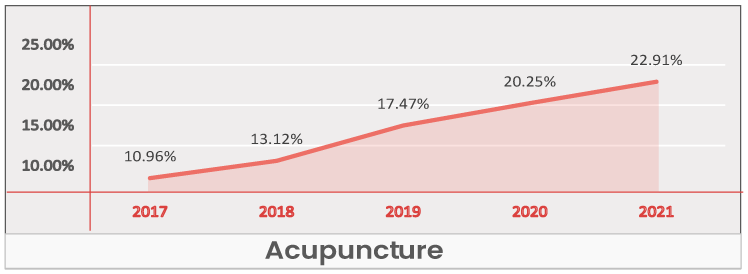
Key Takeaways -
- At a national level and across regions, Acupuncture is an Insignificant benefit.
- Most regions Acupuncture does not drive enrollments but is used as a value add to make plans more competitive.
Coverage Gap

Key Takeaways -
- At a national level and across regions Coverage Gap is identified as an Insignificant benefit with no significance to enrollment gain from our xAI analysis.
- While payors are providing nearly equal number of plans with and without Coverage Gap, there is a clear beneficiary preference towards plans without Coverage Gap.


