2025 AEP Insight: Plan Type Overview📊
Mixed Performance in HMO and PPO SNP plans, with new growth opportunities
October 21, 2024 Market Research

Table of Contents
Breakdown of HMO and PPO Based on SNP Types
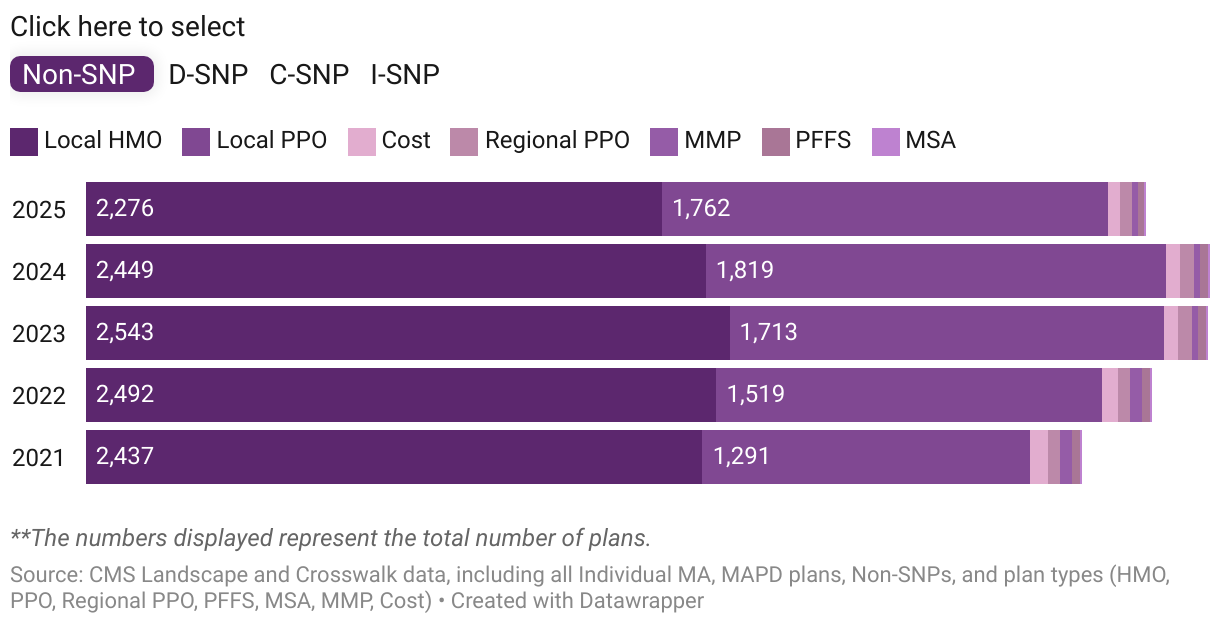
Non-SNP type
Of the total Non-SNP plans, HMO plans account for approximately 54%, slightly down from 2024, while PPO plans represent around 42%. The overall trend for Non-SNPs plan types show a decline across the board, both in total counts and YoY percentages. Local HMO plans experienced the sharpest drop, falling by 173 plans, a 7.1% decrease compared to 2024. Local PPO plans also saw a reduction from 1,819 to 1,762 plan, a 3.1% decrease YoY, despite modest growth in prior years. While Regional PPOs saw a significant 15.7% YoY decrease, losing 8 plans. Other categories also followed this declining trend, with MSA plans remaining stagnant. However, there will be a positive development with the addition of 224 new Non-SNP HMO plans and 292 new non-SNP PPO plans in 2025, indicating a slight recovery in new offerings despite the overall contraction in total plans.
D-SNP type
D-SNP plans continue to exhibit growth, particularly in the Local HMO and PPO categories. HMO plans account for approximately 83% of the total D-SNP offerings. Local HMO plans saw a 6.3% YoY increase, adding 46 plans to reach a total of 780, continuing a steady upward trend from previous years. Local PPO plans grew by 18.1% YoY, adding 25 plans to bring the total to 163. In contrast, Regional PPO plans experienced a decline, dropping by 1 plan and continuing a downward trend. Overall, D-SNP plan offerings are expanding, especially in the HMO and PPO categories, while Regional PPOs continue to shrink. Notably, 124 new HMO plans and 42 new PPO plans were added within the D-SNP category.
C-SNP type
C-SNP saw significant growth, particularly in Local HMO and Local PPO categories. 89% of C-SNPs are HMO plans and 9% are from PPOs. Local HMO plans saw a robust increase of 19.2% YoY, compared to a modest 0.3% in 2024, bringing the total to 348. Local PPO plans also demonstrated strong growth, adding 13 plans to reach a total of 37. In contrast, Regional PPOs remained static, with no changes, holding steady at 6 plans for the fourth consecutive year. Overall, C-SNP plans continue to expand, particularly in Local HMO and PPO offerings, while Regional PPOs show no growth. Notably, 90 new C-SNP HMO plans were introduced, along with an increase in new C-SNP PPO plans, bringing their total to 14 from 6.
I-SNP type
70% of the I-SNPs are coming from HMO plans, remaining are PPOs. Local HMO plans slightly increased to 114, reflecting a modest growth of 2.7% YoY after a decline in the previous year. In contrast, Local PPO plans decreased significantly by 25% YoY, falling to 48 plans, marking a notable downturn following a period of stability. Overall, while Local HMO plans showed slight rise and the decline in Local PPO plans. New HMO I-SNP plans accounted for 15 additions, while PPO plans saw an increase with total of 9.
Read the Comprehensive Report

Discover the Full Series
-
 First-ever shift: Medicare Advantage plan count reduces from 5,805 to 5,682 in 202521 Oct 2024 Market Research
 -
 State-by-State Medicare Advantage Trends: Growth in 38%, Shifts in 54%, Stability in 8%21 Oct 2024 Market Research
 -
 Renewal Plans with SAR increased from 8% to 18% in MA Only plans and from 3% to 11% in MAPD plans.21 Oct 2024 Market Research
 -
 27% of C-SNPs in 2025 are new plans, though no Initial Contracts were introduced21 Oct 2024 Market Research
 -
 New plans increase despite a reduction in total HMO and PPO offerings21 Oct 2024 Market Research