Pennsylvania
Landscape insights this AEP
- October 8, 2025
- 7 min read
Pennsylvania: The Growth Story
While most states contract, Pennsylvania adds 92 plans in 4 years.
Plans Added
Since 2022

Active Payers
+2 from 2025

Counties
Full Coverage

Plans in Lancaster
Most in USA


4-Year Expansion Trajectory
Sustained growth every year
+38% Total Growth
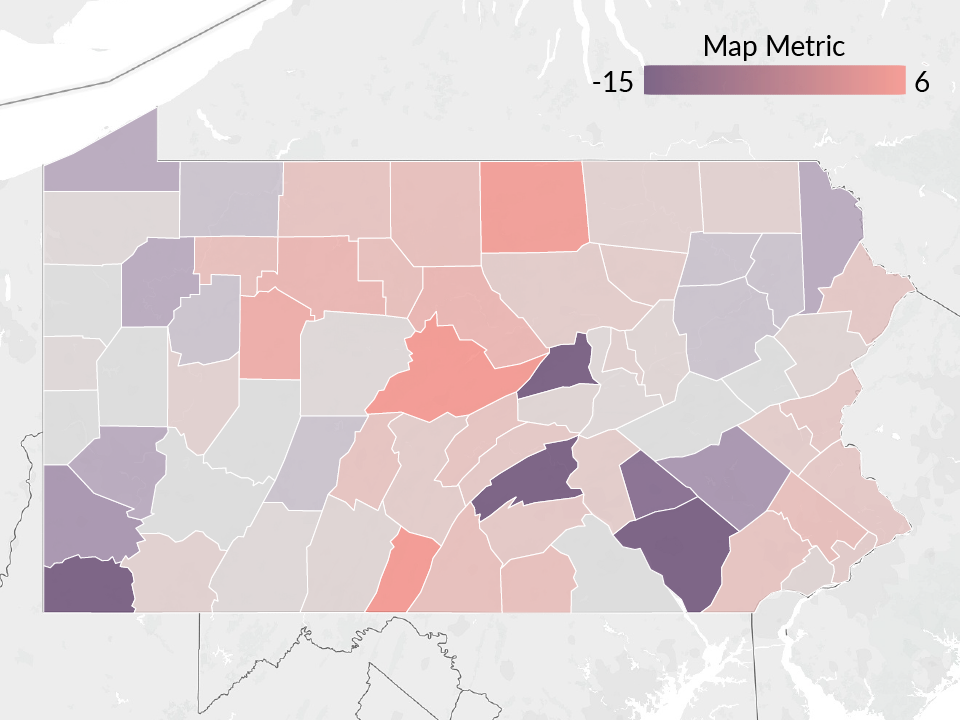
Geographic Moves
County-level changes
Devoted Health
Now in 53 of 67 counties

Universal Coverage
5 Major Payers
- UnitedHealth Group
- Humana
- Highmark Health
- CVS Health
- Independence Health
Plan Type Mix
2026 Distribution
HMO Surge
Fastest growing segment
Market Leaders
By plan count
Highmark Health
Optimizing

CVS Health
Selective Focus

UPMC Health
+5 Plans

Member Costs
2026 Averages
Average Premium
Monthly
Max Out-of-Pocket
Annual
Cost Distribution
Drug Deductibles
Sharp increase
HMO Surge
+81% from $233
$0 Deductible Plans
Down from 48%
Plans Over $600
of 253 non-zero-drug deductible
Why It Matters
Pennsylvania's unique market dynamics
#3 Growth State
+16 plans in 2026 alone

HMO Dominance
186 plans, +27% growth

Premium Market
$30.40 average monthly

While most states see contraction, Pennsylvania proves growth is still possible with the right strategy
+38% 4-Year Expansion
Why HealthworksAI
Be first. Be right. (Not either/or)
Fastest signal → action
- Landscape <36h, PBP/Crosswalk 48h
- Enrollment Forecast 96h (91.2% benchmark)

County precision, not averages
- Defend/Grow/Shrink maps, broker targets
- One-pagers so field teams act where shelf space just opened

Benefits that actually convert
- Benefit sensitivity quick-tests by ZIP (Rx, dental $, flex, utilities) to reallocate budget from low-ROI perks to high-lift levers

20-min readout: top counties, rival moves, benefit levers, commission signals.
Insights from CMS Landscape (<36h turnaround)
